Corrections:
Correction: Utilizing metformin to prevent metabolic syndrome due to androgen deprivation therapy (ADT): a randomized phase II study of metformin in non-diabetic men initiating ADT for advanced prostate cancer
Metrics: PDF 989 views | ?
1Division of Hematology and Oncology, University of Texas Health Science Center, San Antonio, TX 77030, USA
2Robert H Lurie Comprehensive Cancer Center of Northwestern University, Chicago, IL 60611, USA
3Roswell Park Cancer Institute, Buffalo, NY 14263, USA
4Institute for Drug Development, Mays Cancer Center at University of Texas Health, San Antonio, TX 78229, USA
5Audie Murphy VA Hospital, San Antonio, TX 78229, USA
6Division of Experimental Medicine, Lady Davis Institute of Medical Research, Jewish General Hospital, McGill University, Montreal, Canada
7Christus Health, San Antonio, TX 78229, USA
Published: October 19, 2023
Copyright: © 2023 Mahalingam et al. This is an open access article distributed under the terms of the Creative Commons Attribution License (CC BY 4.0), which permits unrestricted use, distribution, and reproduction in any medium, provided the original author and source are credited.
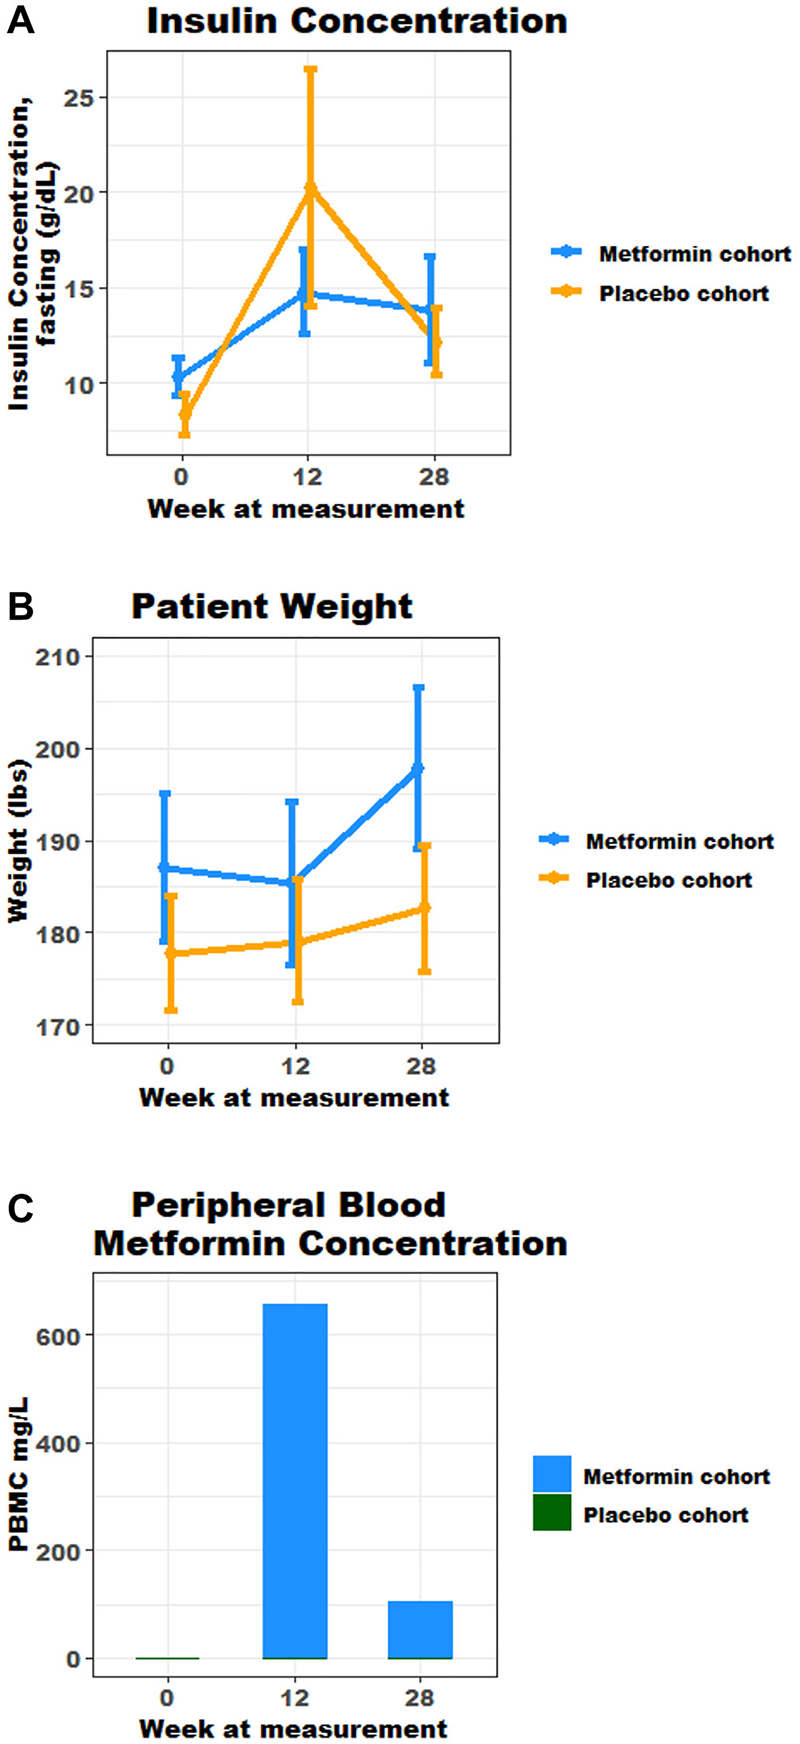
This article has been corrected: In Figure 2A, the insulin concentration graph has been corrected to replace incorrect data due to clerical errors during data entry. The updated Figure 2, produced using the original data, is shown below. In addition, to maintain consistency among mean/median values, the titles of Tables 2 and 3 have been revised, along with the text in the RESULTS section - Metabolic Syndrome paragraph:
Metabolic syndrome
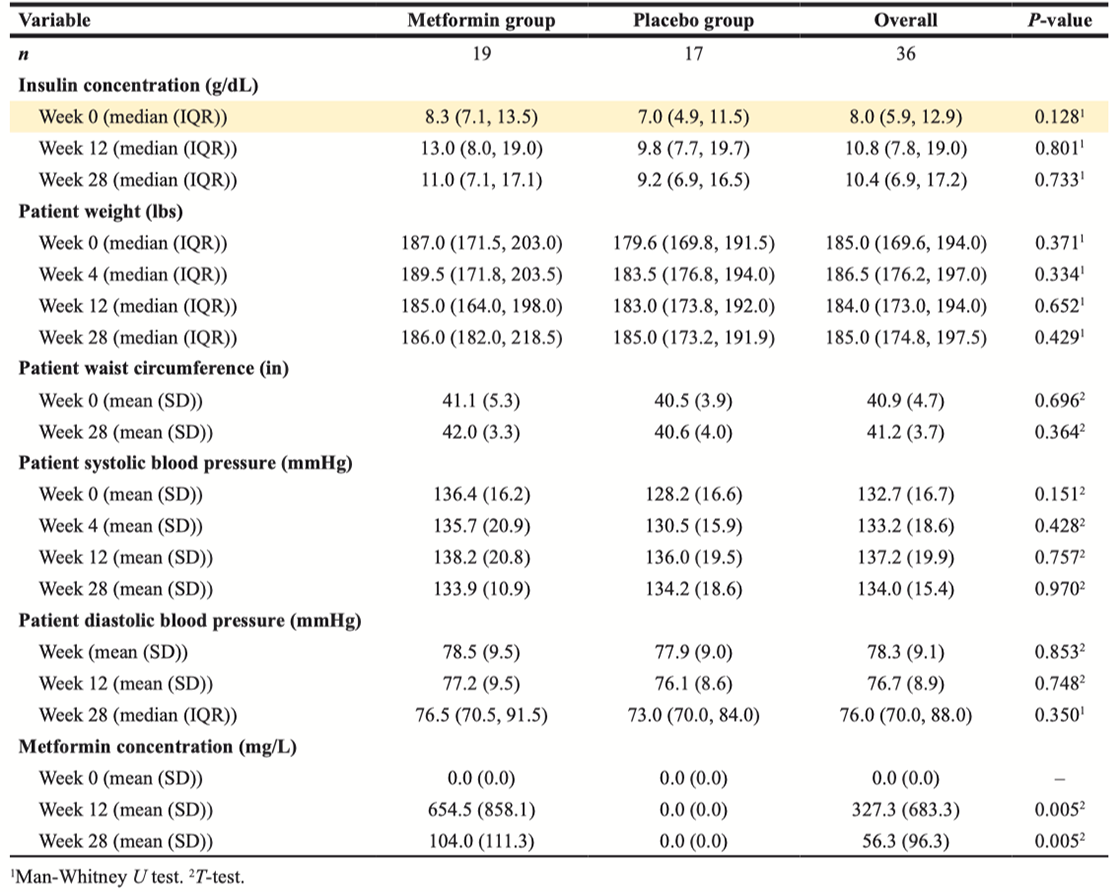
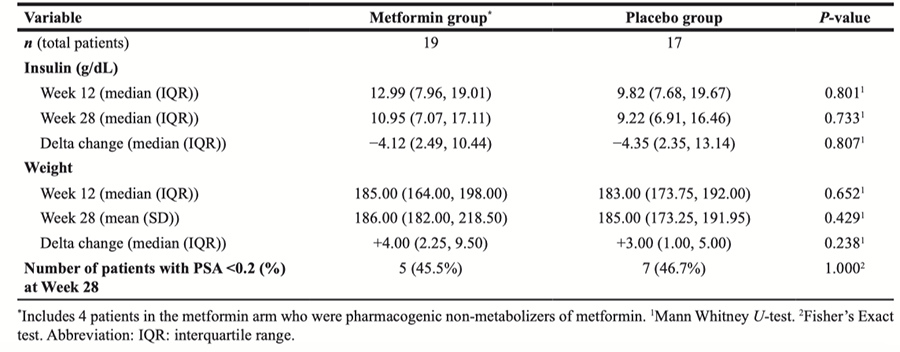
At baseline, markers of metabolic syndrome including median weight, WC, serum Insulin concentration in the metformin cohort were 187 lbs, 41.1 in and 8.3 mIU/L respectively, and 179.6 lbs, 40.5 in and 7.0 mIU/L in the placebo cohort. An increase in mean weight and serum insulin concentrations were seen across both cohorts from baseline to week 28 (Figure 2A and 2B). At week 28, median weight , WC and serum insulin concentration in the metformin cohort were 186.0 lbs and 11.0 mIU/L respectively (Table 2), and mean insulin and weight were highest at weeks 12 and 28; 14.7 mIU/L and 198 lbs (Figure 2A and 2B). In the placebo cohort, at week 28 median weight and serum insulin were 185 lbs and 9.2 mIU/L respectively (Table 2). At week 12 and 28, there was no statistical difference in markers of metabolic syndrome observed in both cohorts (Table 2). It is noteworthy that adjustment for change in weight (Delta) across both groups, also was without statistical difference in increase (Table 3). The authors declare that these corrections do not change the results or conclusions of this paper.
Original article: Oncotarget. 2023; 14:622–636. DOI: https://doi.org/10.18632/oncotarget.28458

Figure 2: (A) Fasting mean insulin concentration over time, marker of metabolic syndrome (g/dL); (B) Mean trend in weight, marker of metabolic syndrome (lbs); (C) Mean peripheral blood metformin concentration over time.

Table 2: Efficacy results in study population

Table 3: Delta change in measures of metabolic syndrome for all patients*
 All site content, except where otherwise noted, is licensed under a Creative Commons Attribution 4.0 License.
PII: 28530

