Corrections:
Correction: iASPP overexpression is associated with clinical outcome in spinal chordoma and influences cellular proliferation, invasion, and sensitivity to cisplatin in vitro
Metrics: PDF 1216 views | ?
1Department of Orthopedics, Peking University Third Hospital, Beijing 100191, China
2The Center for Pain Medicine, Peking University Third Hospital, Beijing 100191, China
*These authors contributed equally to this work
Published: June 21, 2023
Copyright: © 2023 Ma et al. This is an open access article distributed under the terms of the Creative Commons Attribution License (CC BY 4.0), which permits unrestricted use, distribution, and reproduction in any medium, provided the original author and source are credited.
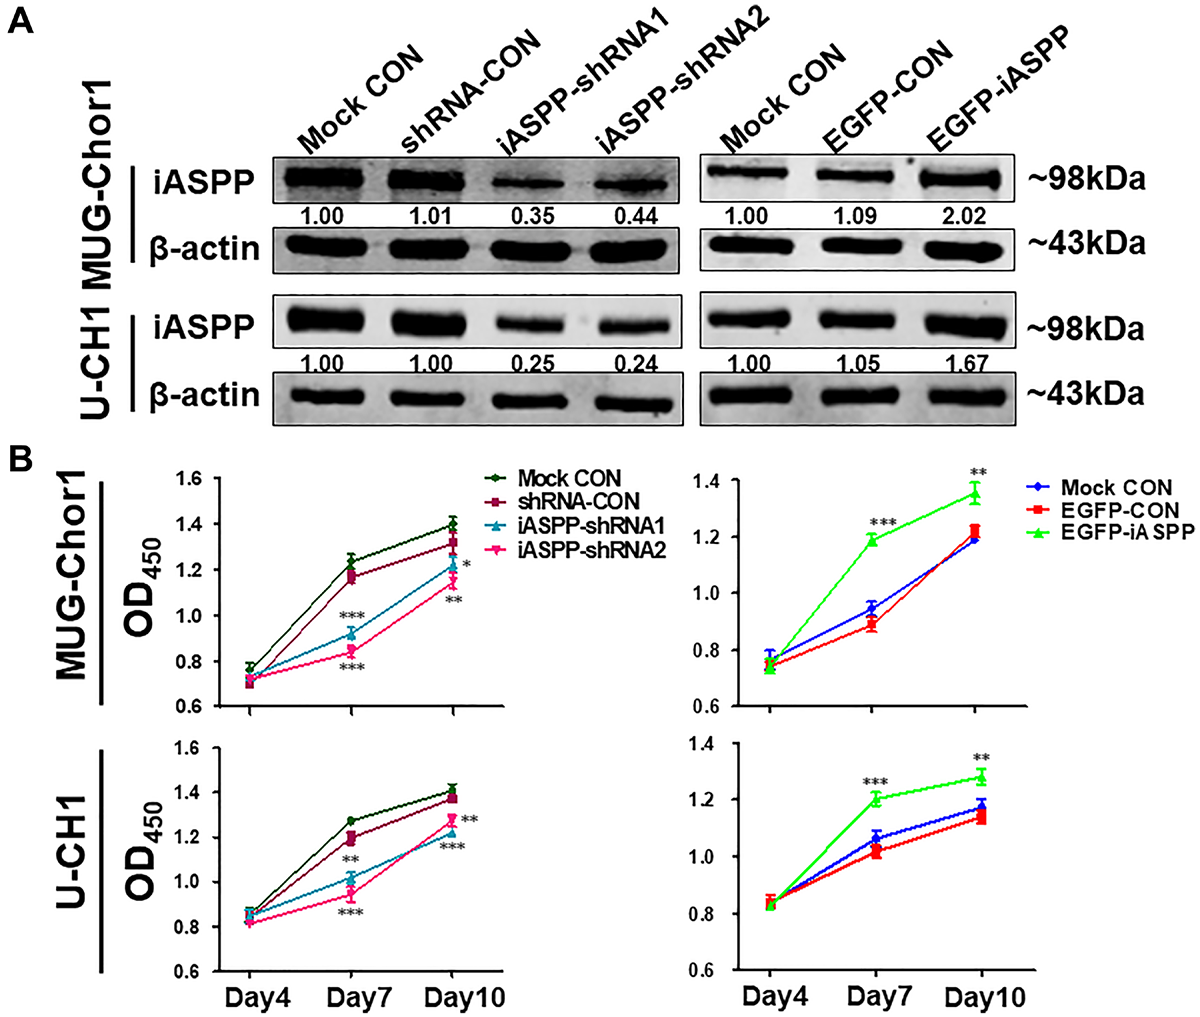
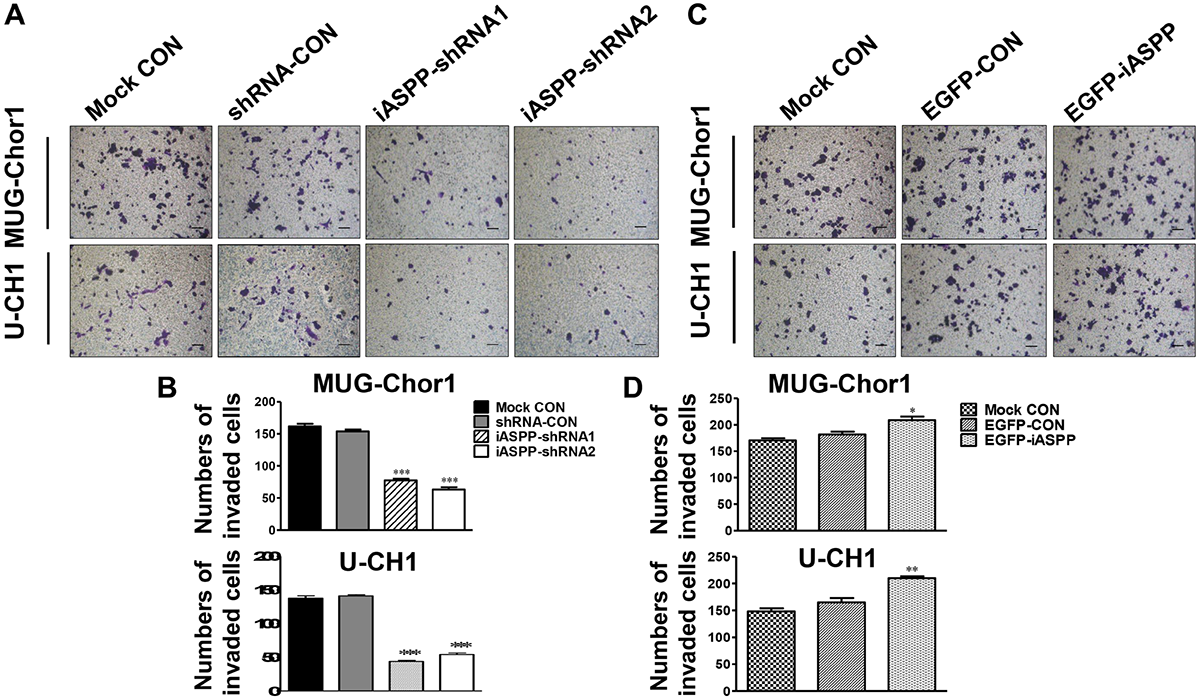
This article has been corrected: In Figure 3A, the WB images for proteins iASPP and b-actin expression in UCH-1 cells have been duplicated and flipped. In addition, in Figure 5A, which shows the data of transwell invasion assays in MUG-Chor1 and U-CH1 cells after the iASPP knockdown, the ‘shRNA-CON’ images for the MUG-Chor1 and U-CH1 cells accidentally overlap. The corrected Figures 3 and 5, produced using the original data, are shown below. The authors declare that these corrections do not change the results or conclusions of this paper.
Original article: Oncotarget. 2017; 8:68365–68380. DOI: https://doi.org/10.18632/oncotarget.20190

Figure 3: The extrinsic knockdown and overexpression of iASPP and their effects on cells proliferation based on CCK-8 assays. (A) The extrinsic knockdown and overexpression of iASPP in MUG-Chor1 and U-CH1 cells as identified by WB. Numbers below pictures represent semi-quantitative analysis of each line by Quantity One software. (B) Proliferation of both cells with iASPP knockdown and overexpression. n = 3. Mean ± SEM. *p < 0.05, **p < 0.01, ***p < 0.001, iASPP-shRNA1 group or iASPPshRNA2 group vs. shRNA-CON group, and EGFP-iASPP group vs. EGFP-CON group. CON: control.

Figure 5: Effect of iASPP knockdown and overexpression on cells invasion. (A) Pictures of transwell invasion assays in MUG-Chor1 and U-CH1 cells after the iASPP knockdown with iASPP-shRNAs. (B) The number of both cells that invaded the substratum of the membrane per view under a 100× magnification after the iASPP knockdown with iASPP-shRNAs. (C) Pictures of transwell invasion assays in MUG-Chor1 and U-CH1 cells after the iASPP overexpression with EGFP-iASPP. (D) The number of both cells that invaded the substratum of the membrane per view under a 100× magnification after the iASPP overexpression with EGFPiASPP. n = 3. Mean ± SEM. *p < 0.05, **p < 0.01, ***p < 0.001, iASPP-shRNA1 group or iASPP-shRNA2 group vs. shRNA-CON group, and EGFP-iASPP group vs. EGFP-CON group. CON: control. Bar scale = 100 μm.
 All site content, except where otherwise noted, is licensed under a Creative Commons Attribution 4.0 License.
PII: 28395
