Corrections:
Correction: P62 regulates resveratrol-mediated Fas/Cav-1 complex formation and transition from autophagy to apoptosis
Metrics: PDF 1410 views | ?
1Open Laboratory for Tumor Molecular Biology/Department of Biochemistry, The Key Lab of Molecular Biology for High Cancer Incidence Coastal Chaoshan Area, Shantou University Medical College, Shantou, China
Published: November 09, 2021
Copyright: © 2021 Zhang et al. This is an open access article distributed under the terms of the Creative Commons Attribution License (CC BY 4.0), which permits unrestricted use, distribution, and reproduction in any medium, provided the original author and source are credited.
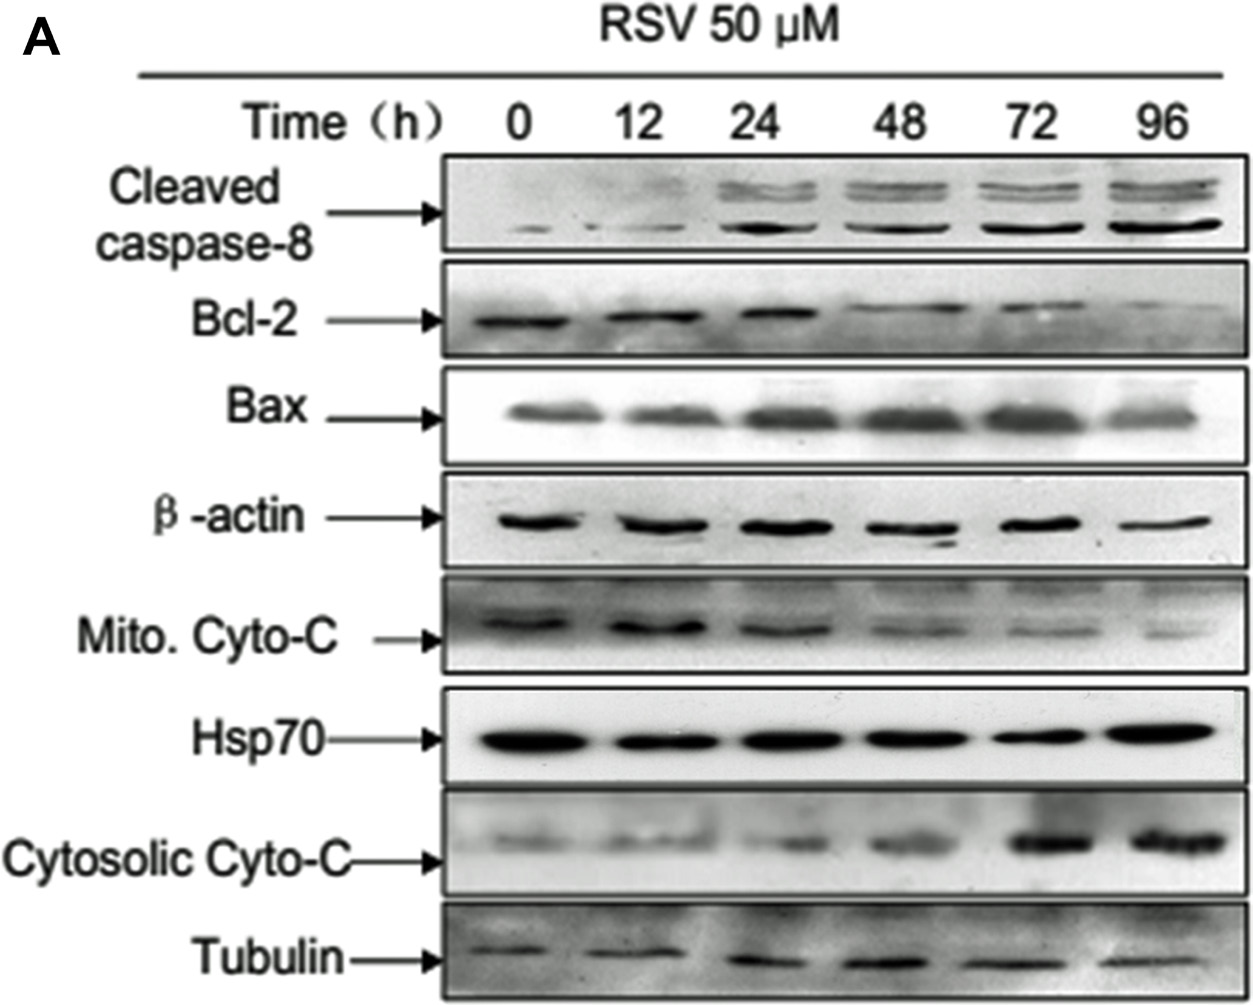
This article has been corrected: Due to errors in image processing, the HSP70 band in Figure 3A is incorrect. While analyzing the data, the authors accidentally selected the 8-bands western blot image from Figure 2A and inserted them into the HSP70 pane of Figure 3A. The corrected Figure 3A is shown below. The authors declare that these corrections do not change the results or conclusions of this paper.
Original article: Oncotarget. 2015; 6:789–801. DOI: https://doi.org/10.18632/oncotarget.2733

Figure 3: Caspase-8 in autophagy and apoptosis in RSV-treated A549 cells. (A) Western blot analysis detected apoptosis-related protein expression levels after treatment with 50 μM RSV at the indicated times. (B) Cells were incubated with 50 μM RSV for the indicated times in the presence or absence of Z-IETD-FMK, then cell lysates were used to analyze the expression of cleaved caspase-8, cleaved caspase-3 and LC3 with the specific antibodies. β-actin was used as the loading control. (C) Cells were exposed to 50 μM RSV plus Z-IETD-FMK for the indicated times, cell viability was determined by MTT assay. (D) Cells were exposed to RSV combined with Z-IETD-FMK for the indicated times. After exposure, cell lysates were obtained and caspase-3 enzymatic activities were measured. (E) A549 cells were pre-incubated with or without Z-IETD-FMK and then treated with 50 μM RSV for the indicated times before detection of cell death by flow cytometry after the staining of FITC-conjugated Annexin-V and PI. The histogram represented quantification analysis based on three independent experiments. Data are means ± SD of three individual determinations, *p < 0.05 and **p < 0.01 vs. respective control cells.
 All site content, except where otherwise noted, is licensed under a Creative Commons Attribution 4.0 License.
PII: 27449
