
INTRODUCTION
Head and neck squamous cell carcinoma (HNSCC) is one of the most common cancer, accounting for over 650,000 new cases and 350,000 cancer deaths every year worldwide [1–3] and HNSCC incidence increases with age. Tobacco smoking, alcohol consumption, environmental exposures, and HPV infection have been identified as important risk factors for HNSCC development. Although there have been improvements in surgery, radiotherapy, and chemotherapy, the 5-year survival for advanced HNSCC remains low. Many efforts have been attempted to identify molecular events that occur during HNSCC development, including the inactivation of TP53, Notch mutations [4, 5], and altered metabolites [6]. Further elucidation of the molecular mechanisms in head and neck carcinogenesis are expected to accelerate the development of efficacious anticancer agents and the identification of diagnostic or therapeutic biomarkers.
DNA methylation is associated with a number of key processes, including embryonic development, X chromosome inactivation, and genomic imprinting. Aberrant DNA methylation has been observed in many cancers [7]. However, the role of DNA methylation in HNSCC initiation and progression remains largely unknown [8].
Gene associated with retinoid-interferon induced mortality-19 (GRIM-19) encodes a subunit of the complex I of mitochondrial membrane respiratory chain and is present in both the nuclear and cytoplasmic cellular compartments. GRIM-19 protein is required for electron transfer activity and complex I assembly [9]. GRIM-19 overexpression induces apoptosis in breast, prostate, and renal carcinoma cells [9]. GRIM-19 binds the Stat3 transcription factor and inhibits Stat3 activity [10]. Altered expression and mutation of GRIM-19 has been observed in various tumors including lung cancer [11], hepatocellular carcinoma (HCC) [12], breast cancer [13], glioma [14], renal cell carcinoma (RCC) [15] and HNSCC [16]. However, the underlying mechanism of GRIM-19 down-regulation remains unclear.
In this study, we used methylated DNA immunoprecipitation (MeDIP) to investigate the whole-genome distribution of aberrant DNA methylation in tissue samples from HNSCC and the oral mucosa of healthy subjects, to identify novel hypermethylated candidate genes in HNSCC. Methylated CpG islands (CGIs) were widespread in the gene-related regions, in which 3034 for normal and 4669 for HNSCC, respectively, and in the genomic unknown regions, in which 1416 for normal and 2376 for HNSCC, respectively. We validated the hypermethylation status of a representative candidate, GRIM-19, in patients with HNSCC. Furthermore, we observed that altered GRIM-19 expression not only regulated p53 and HIF-1α activities, but also altered aerobic glycolysis, cell proliferation and tumorigenic capacity of HNSCC cells. Our results indicate that GRIM-19 hypermethylation may serve as a biomarker in HNSCC.
RESULTS
Genomic distribution of DNA methylation in HNSCC and normal mucosa
DNA methylation has been associated with genome regulation in cancers and normal tissues. To better understand global changes of DNA methylation, genome-wide methylation was examined in both 3 HNSCC tissues and 3 normal mucosa. We observed 2202 methylated CGIs of 7045 (31%) in HNSCC and 1787 of 4450 (40%) in normal mucosa in the 5’-gene related region, (Figure 1A and Figure S1A). Only 1082 of 7045 (15%) in HNSCC and 457 of 4450 (10%) methylated CGIs in normal mucosa were observed in 3’-gene related region. Overall, there were 66% and 68% methylated CGIs located within or near genes. Intriguingly, 34% and 32% of the methylated CGIs were mapped to genomic unknown regions that lack any gene annotation in HNSCC and normal mucosa, respectively (Figure 1A and Figure S1A).
Aberrant hypermethylation in gene promoters has frequently been associated with many cancers types. Among the 2202 methylated CGIs identified in the 5’-gene related region for HNSCC, 81% (1793) methylated CGIs were within +/−1 kb from the transcription start site (TSS) (Figure S1B).
Identification of aberrantly methylated candidate genes in HNSCC
DNA hypermethylation has emerged as sensitive and specific biomarkers in many cancers. We assessed if the differentially methylated CGIs identified in current study could effectively distinguish HNSCC from normal oral mucosa. Figure 1B shows the unsupervised hierarchical clustering of the DNA methylation of normal mucosa compared with HNSCC. The normal and HNSCC samples are correctly classified. Furthermore, 1792 identified methylated CGIs overlapped with 1762 gene promoters. Among these promoters, 918 genes promoters were hypermethylated in at least 1 out of 3 (33%) HNSCC samples, but they were negative in the normal mucosa samples. Because their promoters were hypermethylated in all HNSCC samples but not in normal mucosa samples, 35 genes were defined as highly hypermethylated candidates (Figure 1C). A number of these highly hypermethylated candidates, including SOX1 [17–20], WIF1 [21, 22], ACRC [23], ADCY5 [24], BCAP31 [25], NKX6-2 [26], PLK5P [27], and PRSS21 [28], have previously been reported as promoter hypermethylated genes in various cancers (Table 1). We also identified novel highly hypermethylated genes such as GRIM-19 and ABCD1, which have previously been reported to have altered expressions in cancers [11–14, 29] (Table 2). To further characterize the candidate genes regulated by DNA methylation, we used the KEGG Orthology annotation program to group genes according to their biological functions. Among the hypermethylated candidate genes, six of them including ROCK2, PRKACG, FRAT1, SMAD3, TBL1X, and WIF1 are members of the Wnt signaling pathway (Table 1 and Table S1), which suggests that underexpression of these genes may contribute to head and neck carcinogenesis. In addition, we identified 33 genes that were frequently hypomethylated in the HNSCCs compared with normal mucosa (Table S2), which suggested that hypomethylation mediated activation of these genes may be involved in HNSCC development.
Verification of GRIM-19 promoter hypermethylation in HNSCC
The promoter hypermethylation status of GRIM-19 in HNSCC and normal controls was verified using bisulfate sequencing PCR (BSP) (Figure 2A, B) and methylation-specific PCR (MSP) (Figure 2C) analyses. We observed that GRIM-19 was hypermethylated as predicted in HNSCC lines, but only partially methylated in normal controls (Figure 2B, C). To assess if a demethylation agent could restore transcriptional activity, CAL27 cells were treated with 2.5 or 5 μM 5-AZA for 24 and 48 h. The mRNA expression of GRIM-19 was increased after 5-AZA treatment (Figure 2D), but it was not quantity- or time- dependent (data not shown).
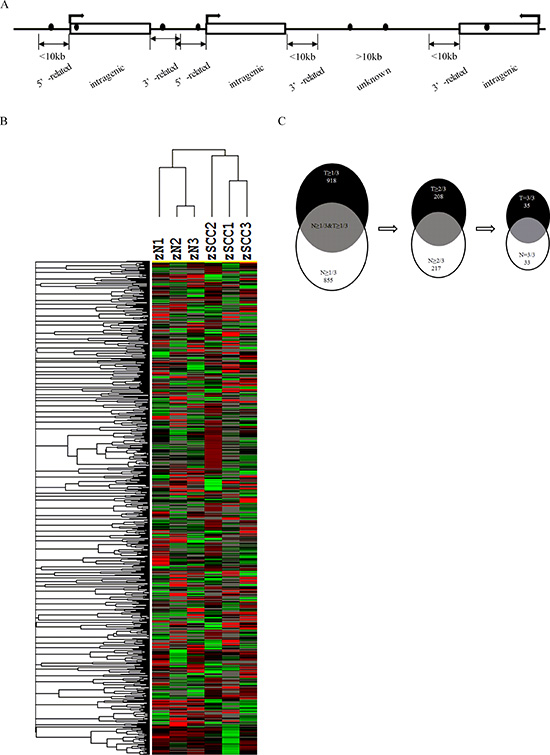
Figure 1: Genome-wide DNA methylation profile and screening for altered DNA methylation candidate genes in HNSCC. (A) Diagram of DNA methylation sites in genome. Black dot, methylated CGI; swerved arrow, direction of transcription; rectangle, a gene; 5′-related, 5′-gene related region; 3′-related, 3′-gene related region; intragenic, intragenic region; unkown, genomic unknown regions without any gene annotations. (B) Two-dimensional hierarchical clustering in HNSCC and control samples. Probes are in rows and samples are in columns. (C) Outline of screening strategy for candidate genes with altered promoter methylation. T, HNSCC; N, normal control.
Table 1: Highly hypermethylated candidate genes in HNSCC
Gene |
Methylation reported in tumor |
Decreased expression in tumor |
KEGG Pathway |
ABCD1 |
Renal CA30 |
Peroxisome |
|
ACRC |
Ewing sarcoma23 |
||
ADCY5 |
Lung adenocarcinoma24 |
Gap junction, Dilated cardiomyopathy |
|
ADM2 |
|||
ATG10 |
|||
B3GNT9 |
|||
BCAP31 |
Breast CA25 |
||
CCNY |
|||
CLCN7 |
|||
FAM148C |
|||
FGD1 |
|||
FJX1 |
|||
GGN |
|||
KCNJ12 |
|||
MAP7D3 |
|||
MBP |
|||
MKL1 |
|||
MMGT1 |
|||
GRIM19 |
Lung CA11, Liver CA12, Breast CA13, Glioma14 |
||
NKX6-2 |
Lung adenocarcinoma24 |
||
NUDT19 |
Peroxisome |
||
PAQR4 |
|||
PLK5P |
Glioblastoma27 |
||
PRSS21 |
Testicular28 |
||
PTF1A |
|||
PTPN20B |
|||
SELO |
|||
SOX1 |
Oral CA17, Cervical CA18, Ovarian CA19, Prostate CA20 |
||
STK25 |
|||
TSPYL2 |
|||
VMA21 |
|||
WDR40B |
|||
WDR40C |
|||
WIF1 |
Oral CA21, Colon CA22 |
Wnt signaling pathway |
|
YJEFN3 |
CA, carcinoma.
Table 2: Clinical features of HNSCC and control
HNSCC |
Control |
|
Number of subjects |
30 |
31 |
Mean age (years, range) |
54 (28-79) |
43 (23-69) |
Age (%) |
||
≤55 |
15 (50%) |
24 (77%) |
>55 |
15 (50%) |
7 (23%) |
Gender (%) |
||
Male |
13 (43%) |
13 (42%) |
Female |
17 (57%) |
18 (58%) |
TMN a stage |
||
T (%) |
||
T 1 |
6 (20%) |
|
T 2 |
9 (30%) |
|
T 3 |
9 (30%) |
|
T 4 |
4 (13%) |
|
NA |
2 (7%) |
|
M (%) |
||
M 0 |
30 (100%) |
|
N (%) |
||
N 0 |
19 (63%) |
|
N 1 |
6 (20%) |
|
N 2 |
3 (10%) |
|
NA |
2 (7%) |
|
Smoking (%) |
||
Never |
21 (70%) |
11 (35%) |
Past |
2 (7%) |
1 (3%) |
Current |
7 (23%) |
3 (10%) |
NA |
0 (0%) |
16 (52%) |
aUnion for International Cancer Control; T, tumor size; N, lymph node; M, Metastasis; NA, data not available; Never, no smoking history; Past, stop smoking over one year. Current, current smoker.
Clinical significance of GRIM-19 promoter hypermethylation in HNSCC
To determine if GRIM-19 is hypermethylated in primary HNSCC in a tumor-specific manner, a new cohort of 30 HNSCC and 31 normal mucosa samples was analyzed using QMSP. The relevant clinicopathologic parameters of the 61 subjects are summarized in Table 1. Our data demonstrated that the median level of GRIM-19 methylation in HNSCC (0.354) was significantly higher compared to normal mucosa tissues (0.067; Mann-Whitney test, P<0.001) (Figure 2E). The GRIM-19 mRNA expression tended to be lower in HNSCC, but the difference was not statistically significant (data not shown). We further sub-grouped subjects into young (≤55 years) and elderly (>55) groups. In both HNSCC and normal samples, elderly subjects had higher hypermethylation levels than younger subjects (Figure 2F). A multivariate regression model analysis revealed that HNSCC diagnosis (OR: 32.275; P = 0.005) and age (OR: 1.163; P = 0.001) were independent risk factors for GRIM-19 hypermethylation. Tumor site, stage, gender, smoking or alcohol consumption was not found to affect GRIM-19 hypermethylation (P>0.05). However, only GRIM-19 hypermethylation was an independent risk factor for HNSCC diagnosis. As the ratio of GRIM-19/ACTB hypermethylation increased by 0.001 increments, the risk for HNSCC increased 125.562- fold (P<0.001). Furthermore, HNSCC patients with a lower ratio of GRIM-19/ACTB hypermethylation were observed to have improved overall survival and disease free survival (Figure 2G, H). To determine the appropriate cutoff for a potential biomarker application, we performed an ROC analysis. The area under ROC (AUC) was 0.88 (P<0.0001). The optimal cutoff, as defined by Youden’s index, provided 90% sensitivity and 77% specificity for GRIM-19 hypermethylation status as a diagnosis marker for HNSCC (Figure 2I).
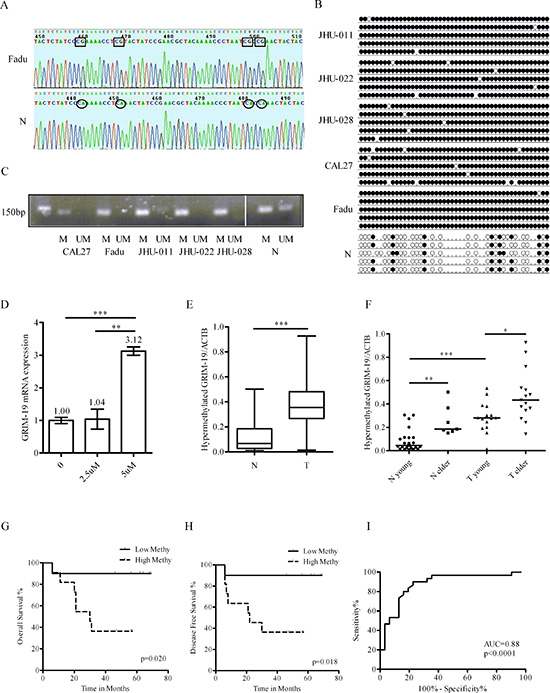
Figure 2: Verification and clinical significance of GRIM-19 hypermethylation. (A) Representative sequences of BSP in Fadu cell line and normal mucosa. Rectangle, sequence of methylated CG; circle, sequence of unmethylated CG. (B) Dot graph of BSP data in HNSCC cell lines and normal mucosa. Black dot, methylated CG; white dot, unmethylated CG; stub, not available. (C) MSP of GRIM-19 in HNSCC cell lines and normal mucosa. (D) RT-QPCR analysis of GRIM-19 mRNA expression after 0, 2.5 or 5 μM 5-AZA treatment for 24 hours. **P < 0.01; ***P < 0.001. (E) Comparison of GRIM-19 hypermethylation between HNSCC and normal by QMSP. N, normal; T, HNSCC. (F) Comparison of GRIM-19 hypermethylation between young and elder subjects by QMSP. *P < 0.05. (G) The overall survival analysis of HNSCC with lower or higher GRIM-19 methylation by Log-Rank test. Low Methy, HNSCC with lower GRIM-19 methylation; High Methy, HNSCC with higher GRIM-19 methylation. (H) The disease free survival analysis of HNSCC with lower or higher GRIM-19 methylation by Log-Rank test. (I) The sensitivity and specificity of GRIM-19 hypermethylation by ROC analysis.
Glucose and oxygen consumption correlates with GRIM-19 expression in HNSCC cell lines
To investigate the metabolic activities of different HNSCC cell lines, we compared the glucose uptake and oxygen consumption of JHU-011, JHU-022, JHU-028, Fadu and CAL27 cells. Fadu and CAL27 cells exhibited lower amounts of glucose uptake per cell and higher rates of oxygen consumption per cell compared with JHU-011, JHU-022 and JHU-028 cells (Figure 3A, B). Next, we examined GRIM-19 protein and mRNA expression in JHU-011, JHU-022, JHU-028, Fadu and CAL27 cells (Figure 3C, D). We observed that GRIM-19 expression in HNSCC cell lines was positively and negatively correlated with oxygen consumption rate and glycolytic activity, respectively. This result suggests that GRIM-19 level may be related to the metabolic activity of HNSCC cells. We decided to choose JHU-028 and CAL27 cells, which had low and high levels of endogenous GRIM-19, respectively, for further GRIM-19 overexpression and knockdown studies.
Ectopic GRIM-19 expression leads to a metabolic switch from aerobic glycolysis to mitochondrial respiration in JHU-028 cells
To determine if increased GRIM-19 expression alters the metabolic and proliferative activity of HNSCC cells, we generated stable JHU-028 cells that overexpressed either HA-tagged GFP cDNA (HA-GFP) or HA-tagged GRIM-19 cDNA (HA-GRIM-19). To observe the effects of GRIM-19 on cancer cell proliferation, we plated JHU-028 cells stably expressing either HA-GFP or HA-GRIM-19 at equal numbers and counted cell numbers at day 1, 2, 3 and 4 after plating. Cell proliferation was impaired in JHU-028 cells stably expressing HA-GRIM-19 compared to control cells (Figure 3E). We did not observe a difference in cell viability between JHU-028 cells stably expressing HA-GRIM-19 and control cells (data not shown). We observed that levels of both p53 phosphorylation (Ser-15) and p21 increased in JHU-028 cells stably expressing HA-GRIM-19 (Figure 3F). Moreover, the mRNA levels of several p53 target genes such as p21, TIGAR and Mdm2 increased when GRIM-19 was overexpressed in JHU-028 cells (Figure 3G). These results indicate that p53 is activated when GRIM-19 expression increases.
Because GRIM-19 is critical for the function of the electron transport chain and oxidative phosphorylation in mitochondria, we next examined the effect of ectopic GRIM-19 expression on oxygen consumption in JHU-028 cells. JHU-028 cells stably expressing HA-GRIM-19 displayed higher rate of oxygen consumption per cell compared to control cells (Figure 3H). However, increased oxygen consumption in JHU-028 cells stably expressing HA-GRIM-19 did not alter ATP levels (Figure 3I), which indicates that the activity of other ATP-producing metabolic pathways may be reduced in these cells. We compared the glycolytic activity of JHU-028 cells stably expressing either HA-GFP or HA-GRIM-19 by quantifying glucose uptake and lactate production per cell (Figure 3J, K). JHU-028 cells stably expressing HA-GRIM-19 displayed reduced glucose uptake and lactate production, indicating a loss of aerobic glycolysis. We observed that levels of both phosphorylated Stat3 and HIF-1α decreased in JHU-028 cells stably expressing HA-GRIM-19 (Figure 3L). Moreover, the mRNA level of several HIF-1α target genes such as HK2, PDK1, PFK1, PKM2 and VEGF decreased when GRIM-19 was overexpressed in JHU-028 cells (Figure 3M).
Stat3 has been reported to regulate epithelial-mesenchymal transition (EMT) of HNSCC [30]. Therefore, we examined mRNA levels of several EMT marker genes in JHU-028 cells stably expressing HA-GFP or HA-GRIM-19. These EMT markers include E-cadherin which is downregulated during EMT as well as N-cadherin, Snail and Twist which are often upregulated during the process [31]. JHU-028 cells ectopically expressing GRIM-19 showed higher E-cadherin mRNA levels compared with control cells (Figure 3N). Ectopic GRIM-19 expression seemed to have mild effect on mRNA expression of N-cadherin, Snail and Twist in JHU-028 cells (Figure 3N).
Since 5-AZA treatment was able to increase GRIM-19 mRNA expression (Figure 2D), we treated JHU-028 cells with control or 5 μM 5-AZA for 24, 48, 72 and 96 hours, respectively and assayed for GRIM-19 mRNA expression, cell proliferation and metabolic activities. As expected, JHU-028 cells treated with 5-AZA showed increased GRIM-19 mRNA levels compared with control-treated cells (Figure 3O). Similar to what we observed in JHU-028 cells overexpressing GRIM-19 (Figure 3E and H), 5-AZA treatment decreased cell proliferation and promoted oxygen consumption in JHU-028 cells (Figure 3P and Figure S2A). However, JHU-028 cells treated with 5-AZA displayed higher rates of glucose uptake and lactate production compared with control cells (Figure S2B and C), which is probably due to the demethylation effect of 5-AZA on other genes directly or indirectly regulating glycolysis.
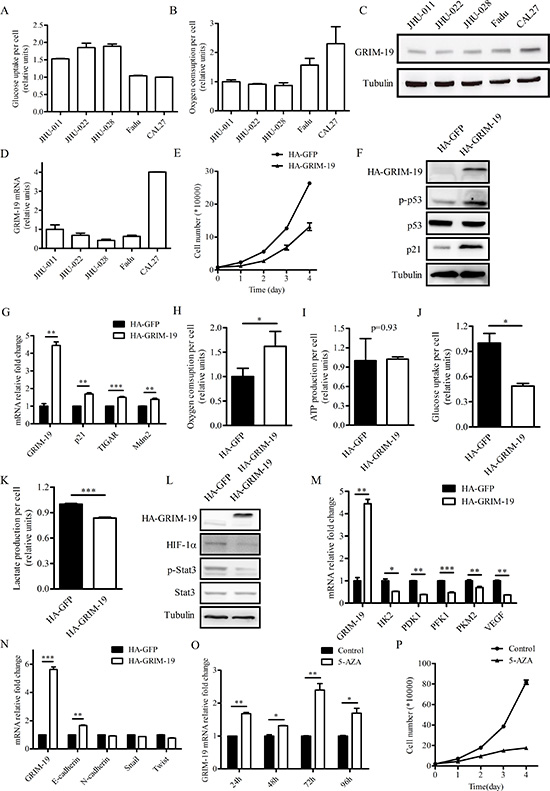
Figure 3: Ectopically expressed GRIM-19 increases oxygen consumption and decreases cell proliferation in JHU-028 cells. (A) Glucose uptake and (B) oxygen consumption of five HNSCC cell lines. The data in (A) and (B) were normalized by cell number. (C) Western blot analysis of protein extracts of five HNSCC cell lines using antibodies to GRIM-19 and tubulin. (D) QPCR analysis of endogenous GRIM-19 mRNA in HNSCC cell lines. (E) Cell proliferation of JHU-028 cells stably expressing either HA-GFP or HA-GRIM-19. (F) Western blot analysis of protein extracts of JHU-028 cells stably expressing either HA-GFP or HA-GRIM-19 using antibodies to HA, p-p53, p53, p21 and tubulin. (G) QPCR analysis of GRIM-19, p21, TIGAR, and Mdm2 in JHU-028 cells stably expressing either HA-GFP or HA-GRIM-19. (H) Oxygen consumption, (I) ATP production, (J) glucose uptake, and (K) lactate production of JHU-028 cells stably expressing either HA-GFP or HA-GRIM-19. (L) Western blot analysis of protein extracts of JHU-028 cells stably expressing either HA-GFP or HA-GRIM-19 using HIF-1α, p-Stat3, Stat3 and tubulin antibodies. (M) QPCR analysis of GRIM-19, HK2, PDK1, PFK1, PKM2 and VEGF in JHU-028 cells stably expressing either HA-GFP or HA-GRIM-19. (N) QPCR analysis of GRIM-19, E-cadherin, N-cadherin, Snail and Twist in JHU-028 cells stably expressing either HA-GFP or HA-GRIM-19. (O) QPCR analysis of endogenous GRIM-19 mRNA in JHU-028 cell lines at 24, 48, 72 and 96 hours after vehicle control or 5 μM 5-AZA treatment. (P) Cell proliferation of JHU-028 cells after vehicle control or 5 μM 5-AZA treatment. Tubulin blots in (C), (F) and (L) serve as loading controls.
Suppression of GRIM-19 increases aerobic glycolysis, cell proliferation and tumorigenic capacity of CAL27 cells
To determine the effects of stable GRIM-19 gene knockdown on the metabolic and proliferative activity of HNSCC cells, we established stable CAL27 cells that expressed either control shRNA or GRIM-19 shRNA. Stable expression of GRIM-19 shRNA led to an obvious decline in GRIM-19 protein levels (Figure 4A). To observe the effects of GRIM-19 knockdown on cancer cell proliferation, we plated CAL27 cells stably expressing either control shRNA or GRIM-19 shRNA at equal numbers and counted cell numbers at day 1, 2, 3 and 4 after plating. Cell proliferation increased in CAL27 cells stably expressing GRIM-19 shRNA compared to control cells (Figure 4B). The levels of both p53 phosphorylation (Ser-15) and p21 decreased in CAL27 cells stably expressing GRIM-19 shRNA (Figure 4C). Moreover, the mRNA levels of several p53 target genes such as p21, TIGAR and Mdm2 decreased when GRIM-19 expression was suppressed in CAL27 cells (Figure 4D).
We next examined the effect of GRIM-19 suppression on oxygen consumption in CAL27 cells. CAL27 cells stably expressing GRIM-19 shRNA displayed lower rate of oxygen consumption per cell compared to control cells (Figure 4E). However, decreased oxygen consumption in CAL27 cells stably expressing GRIM-19 shRNA did not alter ATP levels (Figure 4F). Moreover, CAL27 cells stably expressing GRIM-19 shRNA displayed increased glucose uptake and lactate production (Figure 4G, H), thereby, indicating higher aerobic glycolytic activity. Levels of both phosphorylated Stat3 and HIF-1α increased in CAL27 cells stably expressing GRIM-19 shRNA (Figure 4I). Moreover, the mRNA level of several HIF-1α target genes such as HK2, PDK1, PFK1, PKM2 and VEGF increased when GRIM-19 was suppressed in CAL27 cells (Figure 4J). We also examined mRNA levels of EMT marker genes including E-cadherin, N-cadherin, Snail and Twist in CAL27 cells stably expressing either control shRNA or GRIM-19 shRNA. GRIM-19 knockdown led to decreased E-cadherin mRNA expression and had little effect on mRNA levels of N-cadherin, Snail and Twist in CAL27 cells (Figure 4K).
To determine the effects of GRIM-19 gene knockdown on in vivo tumorigenicity, CAL27 cells stably expressing either control shRNA or GRIM-19 shRNA were subcutaneously injected into 10 nude mice and examined for tumor formation. Each mouse was injected with a control inoculation in one flank and a GRIM-19 shRNA inoculation in the other flank, to ensure tumor comparisons were controlled for each mouse. Tumor growth was monitored every 3 days, and tumors were excised and weighed at 21 days post-injection. The results demonstrated that GRIM-19 knockdown cells formed larger tumors in vivo compared to control cells (Figure 4L, M). Western blot and quantitative PCR analyses of protein and RNA, respectively, from the excised tumors confirmed maintenance of both the GRIM-19 knockdown and lower p53 activation phenotypes (Figure 4N, 4O and Figure S3).
DISCUSSION
In this study, we demonstrated a genome-wide methylation profile and screened for differentially methylated CGIs and candidate genes in tissue samples from HNSCC and normal oral mucosa. Methylated CGIs were widespread in both the gene-related regions and genomic unknown regions in tumor and control tissues. For the first time, we identified and confirmed a novel promoter hypermethylation in GRIM-19 in patients with HNSCC. GRIM-19 hypermethylation may be useful as a marker for HNSCC with 90% sensitivity and 77% specificity. We observed that decreased GRIM-19 expression not only altered the p53- and HIF-1α signaling pathways, but also promoted aerobic glycolysis and cell proliferation in HNSCC cells.
Annotation of the identified methylated CGIs revealed a significant clustering of DNA methylation in the genome in both HNSCC and normal mucosa. We identified numerous promoter regions that were differentially hypermethylated in HNSCC and normal mucosa. We identified 35 candidate genes that had highly hypermethylated promoters in HNSCC. Eight of these genes, including SOX1 [17–20], WIF1 [21, 22], ACRC [23], ADCY5 [24], BCAP31 [25], NKX6-2 [26], PLK5P [27], and PRSS21 [28], have been reported to be hypermethylated in cancers. Two of the highly hypermethylated candidates, namely GRIM-19 [11–14] and ABCD1 [32, 33] have been reported to have altered expressions in cancers. The function of ABCD1 is related to very long chain fatty acid (VLCA) metabolism [29]. Down-regulation of ABCD1 expression in colon and renal cancer has been suggested as a failure of peroxisomal biogenesis [32, 33]. The importance of ABCD1 during HNSCC development needs to be explored further. Indeed, several genes, such as LINE-1 [34], CSPG4 [35], and TKTL1 [36] have been reported to be hypomethylated in HNSCC. In the current study, we observed 33 new candidates of hypomethylation including ABCB6, BTG1 and EPB41L4B. Intriguingly, increased expressions of ABCB6, BTG1 and EPB41L4B were found in glioma [37], thyroid carcinoma [38] and prostate cancer [39], respectively, but the underlying mechanism stays unclear. Our data indicated that hypomethylation might be associated with the increased expressions of these genes.
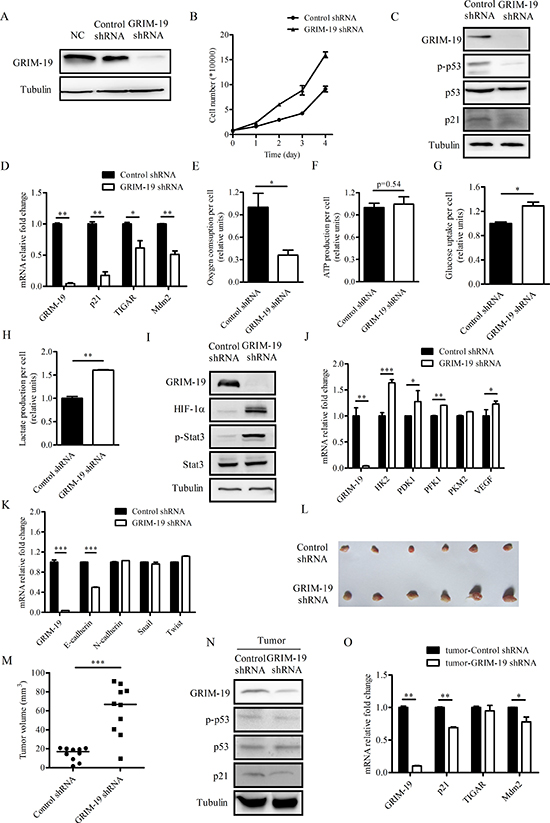
Figure 4: Suppression of GRIM-19 leads to decreased oxygen consumption, increased cell proliferation and tumorigenic capacity in CAL27 cells. (A) Western blot analysis of protein extracts of parental CAL27 cells (NC) and CAL27 cells stably expressing either control or GRIM-19 shRNA using antibodies to GRIM-19 and tubulin. (B) Cell proliferation of CAL27 cells stably expressing either control or GRIM-19 shRNA. (C) Western blot analysis of GRIM-19, p-p53, p53, p21 and tubulin in the protein extracts of CAL27 cells stably expressing either control or GRIM-19 shRNA. (D) QPCR analysis of expression of GRIM-19, p21, TIGAR, and Mdm2 in CAL27 cells stably expressing either control or GRIM-19 shRNA. (E) Oxygen consumption, (F) ATP production, (G) glucose uptake and (H) lactate production of CAL27 cells stably expressing either control or GRIM-19 shRNA. The data in (E) - (H) are normalized by cell number. (I) Western blot analysis of GRIM-19, HIF-1α, p-Stat3, Stat3 and tubulin in the protein extracts of CAL27 cells stably expressing either control or GRIM-19 shRNA. (J) QPCR analysis of GRIM-19, HK2, PDK1, PFK1, PKM2 and VEGF in CAL27 cells stably expressing either control or GRIM-19 shRNA. (K) QPCR analysis of GRIM-19, E-cadherin, N-cadherin, Snail and Twist in CAL27 cells stably expressing either control or GRIM-19 shRNA. (L) Dissected tumors and (M) the mass of tumors from 10 nude mice 21 days after injection of CAL27 cells stably expressing either control or GRIM-19 shRNA. (N) Western blot analysis of protein extracts and (O) QPCR analysis of tumors formed in #1 nude mice 21 days after injection of CAL27 cells stably expressing either control or GRIM-19 shRNA. Western blot analysis of protein extracts of tumors formed in other nude mice were summarized in Figure S3. Tubulin blots in (A), (C), (I) and (N) serve as loading controls.
We identified GRIM-19 as a novel promoter hypermethylated gene. Because IFN/RA-induced apoptosis lacks either a functional p53 and/or caspase-3 mediating pathway, Hophmann et al. isolated GRIM-19 [40], which augmented the effect of IFN/RA-induced apoptosis [9]. Additionally, 93% of RCCs lost GRIM-19 expression [15]. GRIM-19 expression level was negatively correlated with the stage of the primary lesion in lung cancer [11]. Consistently, we observed a tendency toward lower GRIM-19 expression in patients with HNSCC. Promoter hypermethylation provides a possible underlying mechanism for the down-regulation of GRIM-19 expression in HNSCC.
The presence of methylation in healthy subjects has been detected in previous studies [41], and those data reflect chronic environmental exposures, including smoking, physical activity, diet, or carcinogens. Monozygotic twins are epigenetically indistinguishable during the early years of life, but older twins exhibit remarkable differences in their overall content and genomic distribution of DNA methylation [42]. Profiling of young and old murine hematopoietic stem cells (HSCs) has demonstrated that aged HSCs exhibit broader H3K4me3 peaks across HSC identity and have increased DNA methylation at transcription factor binding sites associated with differentiation-promoting genes [43]. We observed significantly different GRIM-19 hypermethylation between young and elderly HNSCC patients as well as between young and elderly controsl. Collectively, age-related changes in DNA methylation may partially underlie the increased cancer risk in the elderly [44].
High rates of aerobic glycolysis or the Warburg effect provides HNSCC with advantages in bioenergetics and biosynthesis [45]. Interestingly, we observed that GRIM-19 expression positively or negatively correlated with oxygen consumption and glycolytic activity in HNSCC cell lines. As a component of complex I in the electron transport system, GRIM-19 is important for regulating the TCA cycle activity [46]. In addition, GRIM-19 has been reported to negatively regulate HIF-1α level in a Stat3-dependent manner in glioblastoma cells [47]. Both HIF-1α and Stat3 promote aerobic glycolysis and downregulate oxidative phosphorylation in cancer cells [48], suggesting that GRIM-19 may downregulate aerobic glycolysis by reducing HIF-1α and Stat3 levels and activities. To determine if altered GRIM-19 levels affect metabolic activities in HNSCC cells, we ectopically expressed GRIM-19 in GRIM-19 low-expressing JHU-028 cells and suppressed GRIM-19 expression in GRIM-19 high-expressing CAL27 cells. As expected, JHU-028 cells stably expressing HA-GRIM-19 displayed increased oxygen consumption as well as reduced glucose uptake and lactate production. Conversely, CAL27 cells stably expressing GRIM-19 shRNA displayed decreased oxygen consumption as well as increased glucose uptake and lactate production. These data indicate that low levels of GRIM-19 contribute to aerobic glycolysis, namely the Warburg effect, in HNSCC cells. We also observed that GRIM-19 overexpression inhibited Stat3 and HIF-1α activities and that GRIM-19 knockdown promoted Stat3 and HIF-1α activities, accompanied by decreased and increased aerobic glycolysis and proliferation, respectively, in HNSCC cells. Our findings indicate that GRIM-19 reprograms metabolic activity of HNSCC cells possibly by regulating the Stat3 and HIF-1α pathways.
Interestingly, treating JHU-028 cells with 5-AZA increased GRIM-19 mRNA expression, decreased cell proliferation and promoted oxygen consumption, which is similar to what we observed in JHU-028 cells overexpressing GRIM-19. We also observed higher glycolytic activity in JHU-028 cells treated with 5-AZA, probably due to the demethylation effect of 5-AZA on other genes directly or indirectly regulating glycolysis. For example, it has been reported that expression of hexokinase and lactate dehydrogenase can be increased by 5-AZA treatment [49].
Increased and decreased p53 activity may partially contribute to the lower and higher rates of cell proliferation in HNSCC cells transfected with GRIM-19 cDNA or shRNA. We determined p53 activity by examining the level of phosphor-p53 (Ser15) and mRNA expression of p53 target genes such as p21, TIGAR and Mdm2. Although Mdm2 protein decreases p53 levels by promoting its protein degradation, increased Mdm2 mRNA expression does not necessarily lead to higher Mdm2 protein levels. Therefore, it is not hard to understand the presence of high or low levels of both phosphor-p53 (Ser15) and Mdm2 mRNA in our findings. The mechanism by which p53 activity is regulated by the level of GRIM-19 remains unknown and should to be elucidated in the future.
Stat3 promotes EMT by regulating many key factors in the process. We found that the mRNA expression of E-cadherin increased or decreased when GRIM-19 was ectopically expressed or suppressed by shRNA in HNSCC cells. Whether GRIM-19 plays a role in EMT by regulating E-cadherin mRNA expression via Stat3 is worthy of further investigation.
MATERIALS AND METHODS
Samples
Tissue samples from HNSCC and the oral mucosa of healthy subjects were obtained from the Department of Oral Mucosal Diseases and the Department of Oral Maxilloficial Surgery of Shanghai 9th People’s Hospital, Shanghai Jiao Tong University School of Medicine. The study was approved by the institutional review board and signed informed consent was obtained from participants. Tissue samples obtained from 3 patients with HNSCC and oral mucosa from 3 healthy subjects were used for a methylated DNA immunoprecipitation (MeDIP) array experiment. Another cohort of 30 HNSCCs and 31 healthy subjects were used for verification. The features of enrolled subjects are summarized in Table 1 and Table S3.
Cell culture
The JHU-011, JHU-022, JHU-028, and Fadu human HNSCC lines were gifts from Dr. Califano at the Johns Hopkins University and were cultured in RPMI 1640 (Invitrogen, Carlsbad, CA, USA) supplemented with 10% FBS, 2 mmol/l L-glutamine, 100 unit/ml penicillin, and 100 g/ml streptomycin at 37ºC in humidified 5% CO2 atmosphere. The CAL27 cell line was obtained from the American Type Culture Collection (ATCC, Rockville, MA, USA) and cultured in DMEM with 10% fetal calf serum at 37°C and 5% CO2.
MeDIP array and data analysis
MeDIP was performed by KangChen Bio-tech (Shanghai, China) using the protocol suggested by NimbleGen (Roche-NimbleGen, Madison, WI, USA) [50]. The NimbleGen HG18 CpG Promoter Array, is a single array design including all well-characterized RefSeq promoter regions and all known CpG Islands annotated by UCSC, and it has 385,000 probes that cover all 24,659 gene promoters reported in the Human RefSeq and 28,226 CGIs annotated in the UCSC genome browser. Array was scanned using the Axon GenePix 4000B microarray scanner and data were extracted using the NimbleScan and SignalMap software. A candidate gene interaction pathway analysis was performed using KEGG orthology. The raw data has been deposited in Experiment-Compliant Database (GEO). The accession number is GSE58630.
Genomic methylation-specific PCR, bisulfite sequencing, and real-time methylation-specific PCR
Genomic DNA was isolated using a Qiagen DNeasy Tissue Kit (Qiagen, Düsseldorf, Germany). Bisulfite treatment was performed using the EpiTect Bisulfite kit (Qiagen, Düsseldorf, Germany) according to the manufacturer’s instructions. Bisulfite-treated DNA 10 ng was used for PCR (BSP). Methylation-specific PCR (MSP) and unmethylation-specific PCR (USP) were performed using a Technet-512 (Technet, Staffordshire, UK). The MSP reaction included an initial incubation at 95°C for 5 min, followed by 40 cycles of 95°C for 30 seconds, 58°C for 20 seconds and 72°C for 20 seconds, followed by one cycle of 72°C for 10 min. For bisulfite sequencing, the PCR product was TOPO-cloned into the pCR4 vector (Invitrogen Life Technologies, CA, USA) and 5 positive clones were selected for sequencing. The real-time methylation-specific PCR (QMSP) reaction included an initial incubation at 95°C for 5 min, followed by 40 cycles of 95°C for 10 seconds, 58°C for 10 seconds, 72°C for 20 seconds, and 81°C for 1 second. SYBR Green I (Sigma-Aldrich, St.Louis, MO, USA) was added following the manufacturer’s instructions. Bisulfite-treated DNA 10 ng was used in QMSP with a LightCycler480 (Roche, Basel, Switzerland). All primers are shown in Table S4.
5-Aza-2’-deoxycytidine treatment
For demethylation analysis, 1.5 × 10⁵ CAL27 cells were seeded, incubated for 24 h and treated with 2.5, 5, and 10 μM 5-aza-2-deoxycytidine (5-AZA, Sigma, St Louis, MO, USA). The media containing 5-AZA was changed every 24 h for 3 days and treated cells were collected at 0, 24, and 48 h. Similarly, JHU-028 cells were treated with control or 5 μM 5-AZA for 24, 48, 72 and 96 h, respectively and assayed for GRIM-19 mRNA levels using real time PCR analysis. Oxygen consumption, glucose uptake and lactate production were measured at 48 h after 5-AZA treatment.
RNA extraction, cDNA synthesis and real-time PCR
Total RNA was extracted using TRIzol (Invitrogen Life Technologies, Carlsbad, CA, USA) according to the manufacturer's instructions. Total RNA was reverse transcribed into cDNA using the PrimeScript™ RT reagent kit (Takara Bio Inc., Shiga, Japan). The SYBR® green Premix Ex Taq TM kit (Takara Bio Inc., Shiga, Japan) was used for real-time PCR (QPCR) analysis which was performed using an ABI 7500 fast Sequence Detector (Applied Biosystems, Carlsbad, CA, USA). All primers are listed in Table S4.
Metabolic assays
To measure oxygen consumption, 80% confluent cells in 10 cm dishes were trypsinized and resuspended in 3 ml of medium. Oxygen consumption was measured using an Oxytherm system (Hansatech, Kings Lynn, UK).
To measure glucose uptake and lactate production, cells were plated in 6-well plates. 48 hours after plating or treatment, culture medium was collected and investigated using the glucose assay kit (Shanghai Rongsheng Biotech, Shanghai, China) and lactate assay kit (Sigma, St Louis, MO, USA) following manufactures’ instructions.
Western blotting analysis
Total protein extracts were obtained using RIPA lysis buffer (Sigma, St Louis, MO, USA). Protein concentration was measured using a BCA Protein Assay kit (Pierce, Rockford, IL, USA). Samples were subsequently resolved in 7.5 and 15% SDS-PAGE gels. Proteins were transferred to Immuno-Blot PVDF Membrane (Bio-Rad, Hercules, CA, USA) and the membranes were blocked using 5% non-fat milk in Tris-buffered saline with Tween-20. The membrane was incubated with primary antibodies followed by incubation with secondary peroxidase labeled anti-rabbit or anti-mouse antibodies (Santa Cruz Biotechnology, Inc., Santa Cruz, CA, USA). The protein signals were detected using an enhanced chemiluminescent solution (Millipore, Boston, MA, USA). Primary antibodies used are listed in the Supplementary Materials.
Cell proliferation
Cells were plated in 6-well plates with a density of 8000 cells/well. Cell numbers were counted at day 1, 2, 3 and 4 after plating.
ShRNA and cDNA transfection
The GRIM-19 shRNA construct was obtained from Open Biosystems (Huntsville, AL, USA) with the following shRNA sequence (sense): 5′-GCGCCTACAAATCGAGGACTT-3′. The cDNA encoding the complete coding region of human GRIM-19 cDNA was obtained from GeneBank (NM 015965.6) and then subcloned into the lentiviral vector.
The shRNA and cDNA were transfected into 293T cells with the packaging plasmids, PMD2G and PSPX2, using Lipofectamine 2000 (Invitrogen Life Technologies, Carlsbad, CA, USA) according to the manufacturer’s instructions. Viral supernatant was collected after 48 h. JHU-028 and CAL27 cells were plated in 10 cm dishes, and the medium was removed after 24 h. Viral supernatant (5 ml) and 5 ml of fresh medium were then added to the cells, and the medium was changed to fresh medium after 24 h. JHU-028 stably transfected cells were selected using flow cytometry, and CAL27 stably transfected cells were selected using 2 μg/ml puromycin.
Xenograft experiments
Xenograft experiments were performed as previously described [51]. Briefly, 1 × 10⁷ CAL27 cells resuspended in 200 μl PBS were subcutaneously injected into the flanks of athymic nude male mice. 10 mice numbered from #1 to #10 were injected. Each mouse was injected in two flanks including a control and a GRIM-19 shRNA inoculation. Tumor size was monitored every 3 days. 21 days after injection, tumors were excised, weighed and assayed for mRNA and protein expression.
Statistical analysis
Statistical analysis was performed using Prism 5 (GraphPad Software, San Diego, CA, USA) and SPSS (IBM, Armonk, NY, USA). Mann-Whitney test was used to compare gene methylation or expression levels between HNSCC and control samples. The overall survival and disease-free survival of patients with HNSCC were analyzed using the Log-Rank test. An ROC analysis was used to measure the separation of clinical settings. Youden’s index was used to provide the optimal a cutoff for sensitivity and specificity for clinical application. All reported P values were 2-sided and P<0.05 was considered statistically significant.
ACKNOWLEDGEMENT
This work was supported in part by National Natural Science Foundation of China (No. 30872887 and No. 81222033), the Program for Professor of Special Appointment (Eastern Scholar) at Shanghai Institutions of Higher Learning and the Program for Shanghai Pu-Jiang Talents from Science and Technology Commission of Shanghai (No. 07PJ14067).
REFERENCES
1. Argiris A, Karamouzis MV, Raben D, Ferris RL. Head and neck cancer. Lancet. 2008; 371:1695–1709.
2. Ridge JA, Lawson J, Yom SS, Garg MK, McDonald MW, Quon H, Saba N, Salama JK, Smith RV, Worden F, Yeung AR, Beitler JJ. American College of Radiology Appropriateness Criteria ((R)) treatment of stage I T1 glottic cancer. Head Neck. 2014; 36:3–8.
3. Pfister DG, Ang KK, Brizel DM, Burtness BA, Busse PM, Caudell JJ, Cmelak AJ, Colevas AD, Dunphy F, Eisele DW, Gilbert J, Gillison ML, Haddad RI, Haughey BH, Hicks WL Jr, Hitchcock YJ, et al. Head and neck cancers, version 2.2013. Featured updates to the NCCN guidelines. J Natl Compr Canc Netw. 11:917–923.
4. Poeta ML, Manola J, Goldwasser MA, Forastiere A, Benoit N, Califano JA, Ridge JA, Goodwin J, Kenady D, Saunders J, Westra W, Sidransky D, Koch WM. TP53 mutations and survival in squamous-cell carcinoma of the head and neck. N Engl J Med. 2007; 357:2552–2561.
5. Agrawal N, Frederick MJ, Pickering CR, Bettegowda C, Chang K, Li RJ, Fakhry C, Xie TX, Zhang J, Wang J, Zhang N, El-Naggar AK, Jasser SA, Weinstein JN, Trevino L, Drummond JA, et al. Exome sequencing of head and neck squamous cell carcinoma reveals inactivating mutations in NOTCH1. Science. 2011; 333:1154–1157.
6. Tripathi P, Kamarajan P, Somashekar BS, MacKinnon N, Chinnaiyan AM, Kapila YL, Rajendiran TM, Ramamoorthy A. Delineating metabolic signatures of head and neck squamous cell carcinoma: phospholipase A2, a potential therapeutic target. Int J Biochem Cell Biol. 2012; 44:1852–1861.
7. Jones PA, Baylin SB. The epigenomics of cancer. Cell. 2007; 128:683–692.
8. Guerrero-Preston R, Michailidi C, Marchionni L, Pickering C, Frederick M, Myers J, Yegnasubramanian S, Hadar T, Noordhuis MG, Zizkova V, Fertig E, Agrawal N, Westra W, Koch W, Califano J, Velculescu VE, et al. Key tumor suppressor genes inactivated by "greater promoter" methylation and somatic mutations in head and neck cancer. Epigenetics. 2014; 9.
9. Angell JE, Lindner DJ, Shapiro PS, Hofmann ER, Kalvakolanu DV. Identification of GRIM-19, a novel cell death-regulatory gene induced by the interferon-beta and retinoic acid combination, using a genetic approach. J Biol Chem. 2000; 275:33416–33426.
10. Lufei C, Ma J, Huang G, Zhang T, Novotny-Diermayr V, Ong CT, Cao X. GRIM-19, a death-regulatory gene product, suppresses Stat3 activity via functional interaction. EMBO J. 2003; 22:1325–1335.
11. Laurent LC, Chen J, Ulitsky I, Mueller FJ, Lu C, Shamir R, Fan JB, Loring JF. Comprehensive microRNA profiling reveals a unique human embryonic stem cell signature dominated by a single seed sequence. Stem cells. 2008; 26:1506–1516.
12. Hao H, Liu J, Liu G, Guan D, Yang Y, Zhang X, Cao X, Liu Q. Depletion of GRIM-19 accelerates hepatocellular carcinoma invasion via inducing EMT and loss of contact inhibition. J Cell Physiol. 2012; 227:1212–1219.
13. Zhou T, Chao L, Rong G, Wang C, Ma R, Wang X. Down-regulation of GRIM-19 is associated with STAT3 overexpression in breast carcinomas. Hum Pathol. 2013; 44:1773–1779.
14. Zhang Y, Hao H, Zhao S, Liu Q, Yuan Q, Ni S, Wang F, Liu S, Wang L, Hao A. Downregulation of GRIM-19 promotes growth and migration of human glioma cells. Cancer Sci. 2011; 102:1991–1999.
15. Alchanati I, Nallar SC, Sun P, Gao L, Hu J, Stein A, Yakirevich E, Konforty D, Alroy I, Zhao X, Reddy SP, Resnick MB, Kalvakolanu DV. A proteomic analysis reveals the loss of expression of the cell death regulatory gene GRIM-19 in human renal cell carcinomas. Oncogene. 2006; 25:7138–7147.
16. Kalvakolanu DV, Nallar SC, Kalakonda S. Cytokine-induced tumor suppressors: a GRIM story. Cytokine. 2010; 52:128–142.
17. Huang YK, Peng BY, Wu CY, Su CT, Wang HC, Lai HC. DNA methylation of PAX1 as a biomarker for oral squamous cell carcinoma. Clin Oral Investig. 2014; 18:801–808.
18. Lai HC, Lin YW, Huang TH, Yan P, Huang RL, Wang HC, Liu J, Chan MW, Chu TY, Sun CA, Chang CC, Yu MH. Identification of novel DNA methylation markers in cervical cancer. Int J Cancer. 2008; 123:161–167.
19. Su HY, Lai HC, Lin YW, Chou YC, Liu CY, Yu MH. An epigenetic marker panel for screening and prognostic prediction of ovarian cancer. Int J Cancer. 2009; 124:387–393.
20. Mathews LA, Hurt EM, Zhang X, Farrar WL. Epigenetic regulation of CpG promoter methylation in invasive prostate cancer cells. Mol Cancer. 2010; 9:267.
21. Supic G, Kozomara R, Jovic N, Zeljic K, Magic Z. Hypermethylation of RUNX3 but not WIF1 gene and its association with stage and nodal status of tongue cancers. Oral Dis. 2011; 17:794–800.
22. Taniguchi H, Yamamoto H, Hirata T, Miyamoto N, Oki M, Nosho K, Adachi Y, Endo T, Imai K, Shinomura Y. Frequent epigenetic inactivation of Wnt inhibitory factor-1 in human gastrointestinal cancers. Oncogene. 2005; 24:7946–7952.
23. Nestheide S, Bridge JA, Barnes M, Frayer R, Sumegi J. Pharmacologic inhibition of epigenetic modification reveals targets of aberrant promoter methylation in Ewing sarcoma. Pediatr Blood Cancer. 2013; 60:1437–1446.
24. Sato T, Arai E, Kohno T, Tsuta K, Watanabe S, Soejima K, Betsuyaku T, Kanai Y. DNA methylation profiles at precancerous stages associated with recurrence of lung adenocarcinoma. PLoS One. 2013; 8:e59444.
25. Fleischer T, Edvardsen H, Solvang HK, Daviaud C, Naume B, Borresen-Dale AL, Kristensen VN, Tost J. Integrated analysis of high-resolution DNA methylation profiles, gene expression, germline genotypes and clinical end points in breast cancer patients. Int J Cancer. 2014; 134:2615–2625.
26. Pradhan MP, Desai A, Palakal MJ. Systems biology approach to stage-wise characterization of epigenetic genes in lung adenocarcinoma. BMC Syst Biol. 2013; 7:141.
27. de Carcer G, Escobar B, Higuero AM, Garcia L, Anson A, Perez G, Mollejo M, Manning G, Melendez B, Abad-Rodriguez J, Malumbres M. Plk5, a polo box domain-only protein with specific roles in neuron differentiation and glioblastoma suppression. Mol Cell Biol. 2011; 31:1225–1239.
28. Manton KJ, Douglas ML, Netzel-Arnett S, Fitzpatrick DR, Nicol DL, Boyd AW, Clements JA, Antalis TM. Hypermethylation of the 5' CpG island of the gene encoding the serine protease Testisin promotes its loss in testicular tumorigenesis. Br J Cancer. 2005; 92:760–769.
29. Kemp S, Pujol A, Waterham HR, van Geel BM, Boehm CD, Raymond GV, Cutting GR, Wanders RJ, Moser HW. ABCD1 mutations and the X-linked adrenoleukodystrophy mutation database: role in diagnosis and clinical correlations. Hum Mutat. 2001; 18:499–515.
30. Masuda M, Wakasaki T, Suzui M, Toh S, Joe AK, Weinstein IB. Stat3 orchestrates tumor development and progression: the Achilles' heel of head and neck cancers? Current cancer drug targets. 2010; 10:117–126.
31. Lamouille S, Xu J, Derynck R. Molecular mechanisms of epithelial-mesenchymal transition. Nature reviews Molecular cell biology. 2014; 15:178–196.
32. Hour TC, Kuo YZ, Liu GY, Kang WY, Huang CY, Tsai YC, Wu WJ, Huang SP, Pu YS. Downregulation of ABCD1 in human renal cell carcinoma. Int J Biol Markers. 2009; 24:171–178.
33. Lauer C, Volkl A, Riedl S, Fahimi HD, Beier K. Impairment of peroxisomal biogenesis in human colon carcinoma. Carcinogenesis. 1999; 20:985–989.
34. Martinez JG, Perez-Escuredo J, Castro-Santos P, Marcos CA, Pendas JL, Fraga MF, Hermsen MA. Hypomethylation of LINE-1, and not centromeric SAT-alpha, is associated with centromeric instability in head and neck squamous cell carcinoma. Cellular oncology (Dordrecht). 2012; 35:259–267.
35. Warta R, Herold-Mende C, Chaisaingmongkol J, Popanda O, Mock A, Mogler C, Osswald F, Herpel E, Kustner S, Eckstein V, Plass C, Plinkert P, Schmezer P, Dyckhoff G. Reduced promoter methylation and increased expression of CSPG4 negatively influences survival of HNSCC patients. International journal of cancer Journal international du cancer. 2014; 135:2727–2734.
36. Sun W, Liu Y, Glazer CA, Shao C, Bhan S, Demokan S, Zhao M, Rudek MA, Ha PK, Califano JA. TKTL1 is activated by promoter hypomethylation and contributes to head and neck squamous cell carcinoma carcinogenesis through increased aerobic glycolysis and HIF1alpha stabilization. Clinical cancer research: an official journal of the American Association for Cancer Research. 2010; 16:857–866.
37. Zhao SG, Chen XF, Wang LG, Yang G, Han DY, Teng L, Yang MC, Wang DY, Shi C, Liu YH, Zheng BJ, Shi CB, Gao X, Rainov NG. Increased expression of ABCB6 enhances protoporphyrin IX accumulation and photodynamic effect in human glioma. Annals of surgical oncology. 2013; 20:4379–4388.
38. Lu YF, Sun GG, Liu Q, Yang CR, Cheng YJ. BTG1 expression in thyroid carcinoma: diagnostic indicator and prognostic marker. International journal of oncology. 2014; 45:1574–1582.
39. Schulz WA, Alexa A, Jung V, Hader C, Hoffmann MJ, Yamanaka M, Fritzsche S, Wlazlinski A, Muller M, Lengauer T, Engers R, Florl AR, Wullich B, Rahnenfuhrer J. Factor interaction analysis for chromosome 8 and DNA methylation alterations highlights innate immune response suppression and cytoskeletal changes in prostate cancer. Molecular cancer. 2007; 6:14.
40. Hofmann ER, Boyanapalli M, Lindner DJ, Weihua X, Hassel BA, Jagus R, Gutierrez PL, Kalvakolanu DV. Thioredoxin reductase mediates cell death effects of the combination of beta interferon and retinoic acid. Mol Cell Biol. 1998; 18:6493–6504.
41. Hoque MO, Feng Q, Toure P, Dem A, Critchlow CW, Hawes SE, Wood T, Jeronimo C, Rosenbaum E, Stern J, Yu M, Trink B, Kiviat NB, Sidransky D. Detection of aberrant methylation of four genes in plasma DNA for the detection of breast cancer. J Clin Oncol. 2006; 24:4262–4269.
42. Fraga MF, Ballestar E, Paz MF, Ropero S, Setien F, Ballestar ML, Heine-Suner D, Cigudosa JC, Urioste M, Benitez J, Boix-Chornet M, Sanchez-Aguilera A, Ling C, Carlsson E, Poulsen P, Vaag A, et al. Epigenetic differences arise during the lifetime of monozygotic twins. Proc Natl Acad Sci U S A. 2005; 102:10604–10609.
43. Sun D, Luo M, Jeong M, Rodriguez B, Xia Z, Hannah R, Wang H, Le T, Faull KF, Chen R, Gu H, Bock C, Meissner A, Gottgens B, Darlington GJ, Li W, et al. Epigenomic Profiling of Young and Aged HSCs Reveals Concerted Changes during Aging that Reinforce Self-Renewal. Cell Stem Cell. 2014; 14:673–688.
44. Gautrey HE, van Otterdijk SD, Cordell HJ, Mathers JC, Strathdee G. DNA methylation abnormalities at gene promoters are extensive and variable in the elderly and phenocopy cancer cells. FASEB J. 2014; 28:3261–3272.
45. Tripathi P, Kamarajan P, Somashekar BS, MacKinnon N, Chinnaiyan AM, Kapila YL, Rajendiran TM, Ramamoorthy A. Delineating metabolic signatures of head and neck squamous cell carcinoma: phospholipase A2, a potential therapeutic target. Int J Biochem Cell Biol. 2011; 44:1852–1861.
46. Fearnley IM, Carroll J, Shannon RJ, Runswick MJ, Walker JE, Hirst J. GRIM-19, a cell death regulatory gene product, is a subunit of bovine mitochondrial NADH:ubiquinone oxidoreductase (complex I). J Biol Chem. 2001; 276:38345–38348.
47. Liu Q, Wang L, Wang Z, Yang Y, Tian J, Liu G, Guan D, Cao X, Zhang Y, Hao A. GRIM-19 opposes reprogramming of glioblastoma cell metabolism via HIF1alpha destabilization. Carcinogenesis. 2013; 34:1728–1736.
48. Darnell JE Jr. STAT3, HIF-1, glucose addiction and Warburg effect. Aging. 2010; 2:890–891.
49. Wolf A, Agnihotri S, Munoz D, Guha A. Developmental profile and regulation of the glycolytic enzyme hexokinase 2 in normal brain and glioblastoma multiforme. Neurobiology of disease. 2011; 44:84–91.
50. Liang P, Song F, Ghosh S, Morien E, Qin M, Mahmood S, Fujiwara K, Igarashi J, Nagase H, Held WA. Genome-wide survey reveals dynamic widespread tissue-specific changes in DNA methylation during development. BMC Genomics. 2011; 12:231.
51. Tong X, Zhao F, Mancuso A, Gruber JJ, Thompson CB. The glucose-responsive transcription factor ChREBP contributes to glucose-dependent anabolic synthesis and cell proliferation. Proceedings of the National Academy of Sciences of the United States of America. 2009; 106:21660–21665.