
INTRODUCTION
Pancreatic cancer is challenging to diagnose at an early stage and is highly metastatic; consequently, the overall survival rate for patients with pancreatic cancer is only ~8%. Pancreatic cancer is currently the fourth-leading and third-leading cause of cancer death in Japan and USA, respectively [1, 2]. Most pancreatic cancer patients are aged >60 years old, and the aging population is rapidly increasing worldwide. By 2030, pancreatic cancer is expected to become the second-leading cause of cancer-related deaths in USA [3]. A major histological subtype of pancreatic cancer is pancreatic ductal adenocarcinoma (PDAC), which accounts for 90% of all pancreatic cancer cases. Surgical treatment offers the only possible cure for PDAC, but 80% of all PDAC patients are inoperable at diagnosis. Moreover, even after surgery, the 5-year survival rate is only 15%–20%, because of the high metastatic rate and local recurrence of the cancer [4]. Currently, chemotherapies or chemoradiotherapies can reduce tumor size and improve prognosis, but these treatments do not eliminate all PDAC cells in the patients. Therefore, understanding the molecular mechanisms of PDAC carcinogenesis and metastasis could facilitate the identification of potential tumor biomarkers and the development of effective therapeutic strategies against metastasis and recurrence.
According to the central dogma of biology, RNA constitutes the intermediary between DNA and protein. However, recent genome-wide transcriptome studies have revealed that almost the entire human genome is transcribed and produces a plethora of non-coding RNAs (ncRNAs) [5–7]. Long ncRNAs (lncRNAs), which are mRNA-like transcripts containing >200 ribonucleotides, function as critical regulators of gene expression by participating in epigenetic modification, transcriptional control, RNA- processing control, translational control, and posttranslational modification [8]. Accumulating evidence suggests that lncRNAs play crucial roles in carcinogenesis and in the growth and metastasis of various types of cancer, although their detailed mechanisms of action remain unclear [5, 6, 9, 10].
The H19 gene, located at human chromosome 11p15.5, encodes an imprinted lncRNA. H19 is transcribed exclusively from the maternal allele, and the gene also generates an oncofetal RNA that is expressed in the developing embryo and in certain types of tumor [11, 12]. Recent evidence indicates that H19 enhances invasion and metastasis in bladder cancer [13, 14], glioma [15], osteosarcoma [16], acute myeloid leukemia [17], breast cancer [18, 19], non-small cell lung cancer [20], gastric cancer [21], and pancreatic cancer [22], but suppresses the aggressiveness of hepatocellular carcinoma [23] and prostate cancer [24].
We recently reported that H19 was the highest-expressed ncRNA in PANC-1 lung metastasis-derived human pancreatic cancer cells and that inhibition of H19 decreased the lung and liver metastases of pancreatic cancer in immunodeficient mice [25]; this finding indicates that H19 represents a novel candidate for targeted therapy against pancreatic cancer metastasis. However, the molecular mechanisms of H19 contribution in PDAC cells remain poorly clarified. Therefore, we examined the mechanisms by which H19 regulates PDAC metastasis, with a focus on cancer stem cells (CSCs), by using PDAC cells in which H19 was either overexpressed or depleted. Here, we show that H19 promotes sphere formation, which indicates self-renewal ability, and invasion by regulating integrin and CD24 expression in PDAC cells.
RESULTS
H19 expression in PDAC cells
To determine whether H19 is expressed heterogeneously or homogeneously in human PDAC cells, we examined H19 expression in PANC-1 cells by using a highly sensitive in situ hybridization technique. Under the adherent-culture condition, PANC-1 cells showed heterogeneous H19 expression and the presence of small populations of H19-expressing cells (Figure 1A, left panel, arrow). In a previous report [26], we showed that 3D-culture conditions induce CSC-like populations in PANC-1 cells. Here, at 7 days after sphere formation under 3D-culture conditions, higher H19 expression was detected among the sphere cells than in cells cultured under the adherent-culture condition (Figure 1B). Numerous H19-expressing PANC-1 cells were detected in spheres by using in situ hybridization (Figure 1A, right panel, arrow). These results suggest that H19 is expressed in CSC-like cells among PANC-1 cells. CSCs are responsible for tumor initiation, growth, and even metastasis [27]. We previously showed that H19 contributes to liver and lung metastases in PANC-1 cells [25]. Thus, we hypothesized that a correlation exists between H19 and CSCs, and we examined the mechanisms by which H19 affects CSC phenotypes (Figure 1C).
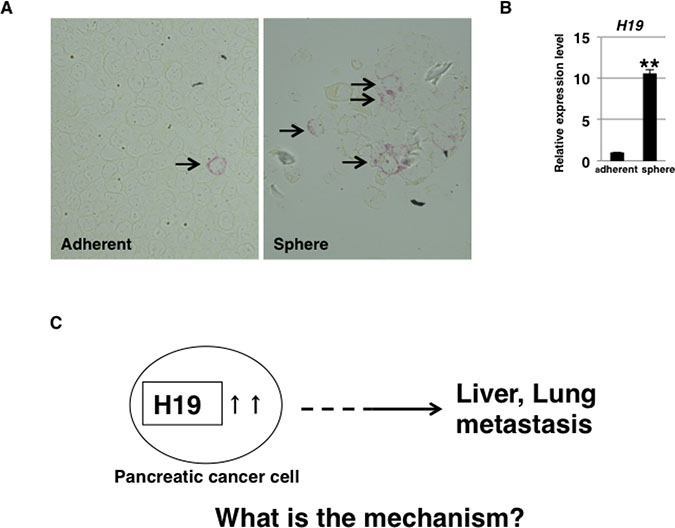
Figure 1: H19 expression in PDAC cells. (A) H19 expression was analyzed by performing in situ hybridization in PANC-1 cells. Fewer H19-expressing cells were detected among PANC-1 cells cultured under the adherent condition (left) than among PANC-1-cell spheres (right). Original magnification, 400×. (B) qRT-PCR analysis of H19 was performed using cDNA derived from adherent and 3D-cultured PANC-1 cells. **P < 0.01. (C) Schematic depiction of the question addressed in this study. Results are presented as means ± SD from three independent experiments.
H19 contributes to sphere formation in PDAC cells
To clarify the involvement of H19 in the development of CSC characteristics, we examined self-renewal ability and CSC-marker expression in H19-overexpressing and -knockdown PDAC cells by performing sphere-formation assays and stemness-marker analysis. Quantitative reverse transcription-polymerase chain reaction (qRT-PCR) analysis confirmed increased and decreased H19 expression in H19-overexpressing and -knockdown PANC-1 cells, respectively (Figure 2A). The results of sphere-formation assays showed that relative to the control, H19-overexpressing and -knockdown cells exhibited, respectively, higher sphere formation (Figure 2B) and lower sphere formation (Figure 2C). Furthermore, qRT-PCR analysis revealed that 2 out of 6 examined stemness-markers (CD24 and CD44v9) were expressed at lower levels in H19-overexpressing cells than in mock cells (Figure 2D), whereas, 1 of the 6 markers (NESTIN) was expressed at a higher level in H19-knockdown cells than in scrambled-sequence short-hairpin (sh) RNA-transfected (Sc) cells (Figure 2E). These results indicate that H19 promotes sphere-formation but is not clearly involved in stemness-marker expression in PDAC cells.
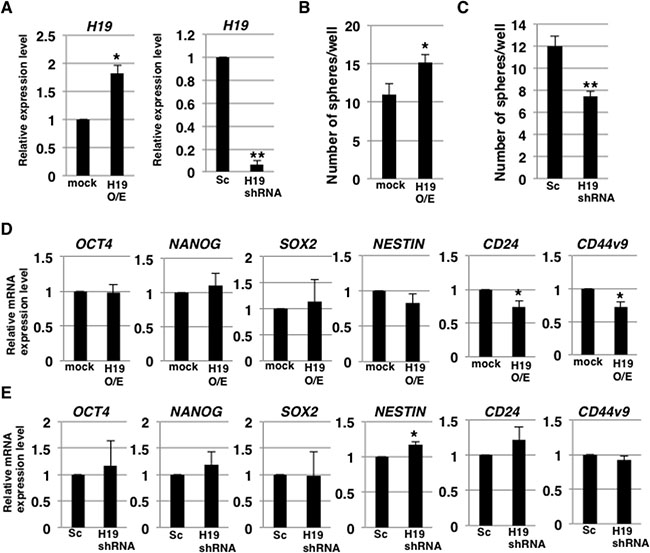
Figure 2: H19 contributes to sphere formation in PDAC cells. (A) qRT-PCR analysis of H19 was performed using cDNA derived from mock and H19-overexpressing cells or Sc and H19-knockdown cells. Results are normalized relative to the values obtained for mock or Sc cells (value = 1). *P < 0.05, **P < 0.01. (B and C) Results of sphere-formation assays showing increased and decreased sphere formation by, respectively, H19-overexpressing cells (B) and H19-knockdown cells (C). *P < 0.05, **P < 0.01. (D and E) qRT-PCR analysis of stemness markers was performed using cDNA derived from mock and H19-overexpressing cells (D) or Sc and H19-knockdown cells (E). Results are normalized relative to the values obtained for mock or Sc cells (value = 1). *P < 0.05. Results are presented as means ± SD from three independent experiments.
CSCs possess an effective efflux pathway for anticancer drugs. Thus, we next examined whether H19 contributes to anticancer-drug resistance in PDAC cells. We tested three commonly used anti-pancreatic cancer drugs, gemcitabine, 5-FU, and abraxane. Survival rates of the cells after addition of gemcitabine, 5-FU, and abraxane (all at 100 μM) were approximately 10%, 30%, and 10%, respectively (Figure 3A). The survival rates did not differ in a statistically significant manner between mock and H19-overexpressing cells or between Sc and H19-knockdown cells, after treatment with the anticancer drugs at either 10 or 100 μM (Figure 3A). Furthermore, we examined the gene-expression levels of three potential anticancer drug transporters: qRT-PCR analysis revealed that the expression of ABCG2, ABCC1, and ABCC2 was not significantly different between mock and H19-overexpressing cells, or between Sc and H19-knockdown cells (Figure 3B). These results indicate that H19 is not involved in regulating the expression of anticancer drug transporters and the resistance toward anticancer drugs in PDAC cells.
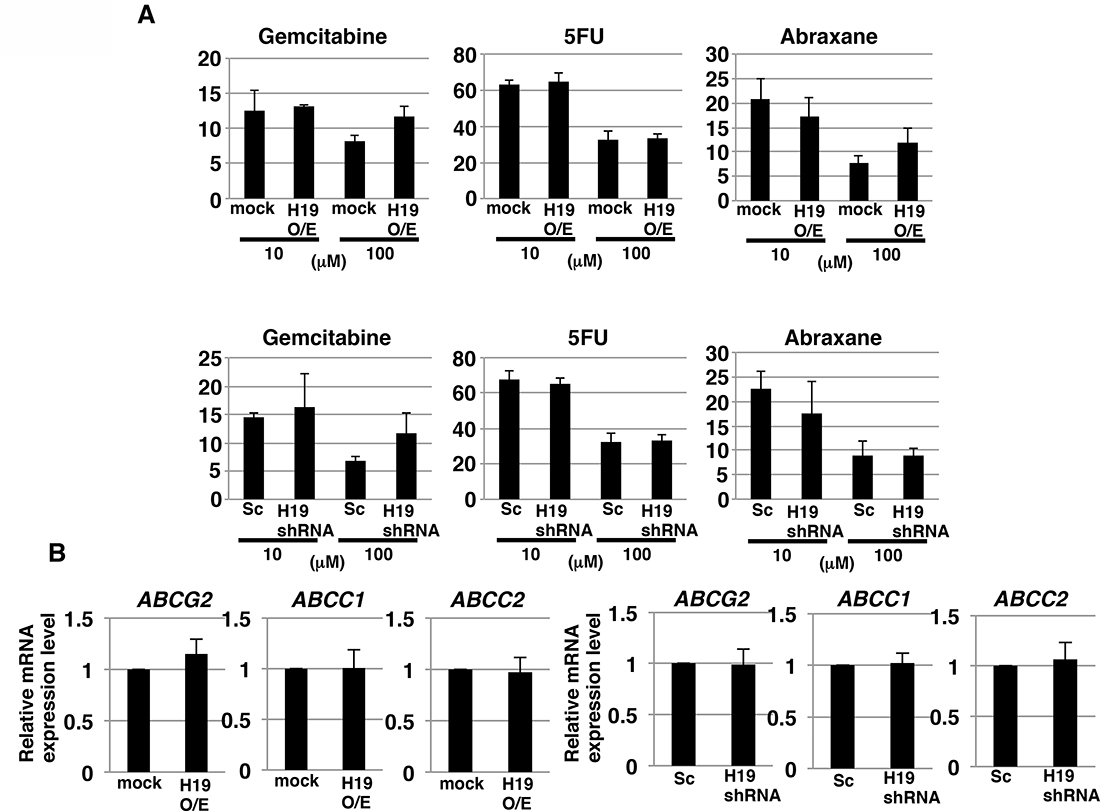
Figure 3: H19 does not contribute to anticancer-drug resistance in PDAC cells. (A) ATP assay results showing the resistance of mock and H19-overexpressing cells or Sc and H19-knockdown cells against three drugs tested at 10 and 100 μM: gemcitabine, 5-FU, and abraxane. (B) qRT-PCR analysis of transporter expression was performed using cDNA derived from mock and H19-overexpressing cells or Sc and H19-knockdown cells. Results are presented as means ± SD from three independent experiments.
H19 promotes invasion in PDAC cells
In our previous report [25], we demonstrated that H19 contributes to liver and lung metastases in PDAC cells. During the metastatic cascade, invasion into the surrounding stroma is a key step, and we thus investigated whether H19 functions in the invasion process. In invasion assays performed using inserts coated with Matrigel, which mimics the in vivo basement membrane, a larger number of H19-overexpressing cells than mock cells invaded through the pores of the insert membrane (Figure 4A). By contrast, H19-knockdown cells exhibited lower invasion than Sc cells (Figure 4B). Under 3D-culture conditions, CSC-like populations are enriched, and we showed that H19 was highly expressed in sphere cells (Figure 1B). Therefore, to clarify the contribution of H19 in sphere cells, we performed 3D invasion assays, which revealed that in the 3D invasion, Sc sphere cells exhibited the typical starburst invasion pattern to a greater extent than did H19-knockdown sphere cells at Day 16 (Figure 4C). These results indicate that H19 contributes to invasion in PDAC cells.
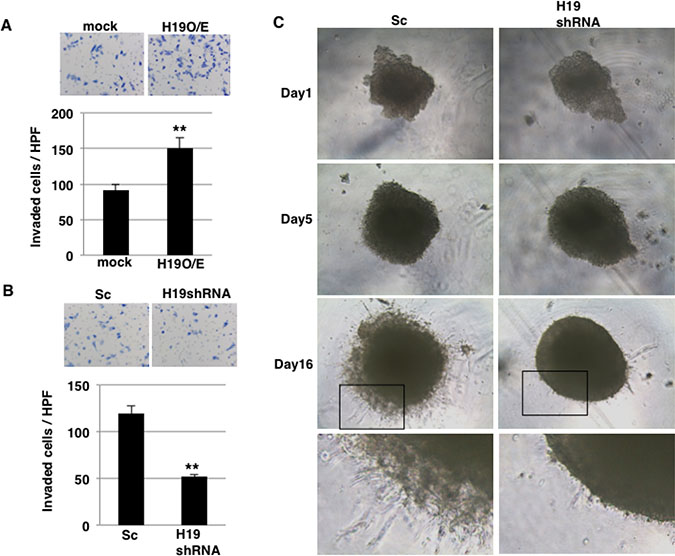
Figure 4: H19 promotes invasion in PDAC cells. (A and B) Matrigel invasion assays were performed using mock and H19-overexpressing cells (A) or Sc and H19-knockdown cells (B). **P < 0.01. (C) 3D invasion assays were performed using Sc and H19-knockdown cells. Representative images from Days 1, 5, and 16 are shown. The high-magnification images show that typical invasive cells were more numerous among Sc cells than H19-knockdown cells.
Highly elevated production of matrix metalloproteinases (MMPs) is recognized as a key feature of invasion [28]. Thus, we hypothesized that H19 might promote MMP expression and activity. However, qRT-PCR analysis revealed that the expression levels of MMP2, MMP9, and MT1MMP, which are known to be expressed in PDAC cells [29, 30], were not substantially different between H19-overexpressing cells and mock cells (Figure 5A), although relative to Sc cells, H19-knockdown cells showed MMP9 downregulation and MT1MMP upregulation (Figure 5A). Moreover, the collagenase activity of MMP2 and MMP9 did not differ markedly between mock and H19-overexpressing cells, or between Sc and H19-knockdown cells (Figure 5B). These results suggest that H19 is not involved in the regulation of MMP expression and activity in PDAC cells.
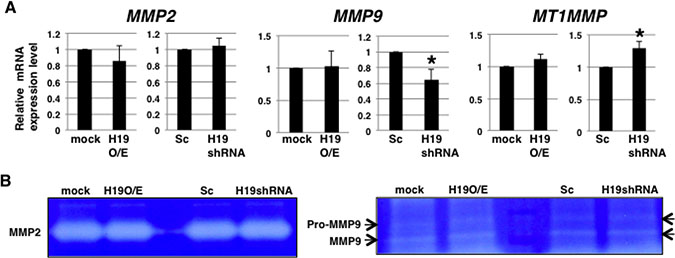
Figure 5: H19 does not contribute to MMP activity in PDAC cells. (A) qRT-PCR analysis of MMPs was performed using cDNA derived from mock and H19-overexpressing cells or Sc and H19-knockdown cells. Results are presented as means ± SD from three independent experiments. *P < 0.05. (B) Gelatin zymography analyses were performed using culture supernatants from mock and H19-overexpressing cells or Sc and H19-knockdown cells. Representative results from three independent experiments are shown.
H19 contributes to cell adhesion through regulation of CD24 and integrin expression in PDAC cells
During the process of invasion, a critical event is the adhesion of cancer cells to the extracellular matrix [31]. We investigated whether H19 contributes to this cell-to-matrix adhesion step. Adhesion assays on Matrigel revealed that H19-overexpressing cells exhibited a statistically significant increase in adhesiveness (~50% adherent cells, versus ~40% in the case of mock cells) (Figure 6A), whereas H19-knockdown cells exhibited a significant decrease in adhesiveness (~35% adherent cells, versus ~40% in the case of Sc cells) (Figure 6B). These results indicate that H19 supports cell-matrix adhesion. Integrins, which mediate the crosstalk between tumor cells and basement-membrane proteins, are major cell-surface receptors and play a critical role in cell adhesion, invasion, and metastasis induction [32–34]. We therefore investigated whether H19 promotes cell adhesion through regulation of integrins. qRT-PCR results showed that, while α1-integrin was upregulated in H19-overexpressing cells (Figure 6C), it was downregulated in H19-knockdown cells (Figure 6D), which suggests that H19 positively regulates the expression of α1-integrin. Furthermore, we examined the cell-surface expression of integrins and that of the epithelial marker CD24. Fluorescence-activated cell sorting (FACS) analysis revealed that α1-integrin expression was low in mock cells, but markedly increased in H19-overexpressing cells, and that CD24 expression was reduced in H19-overexpressing cells (Figure 6E). This suggested that H19-overexpressing cells present metastatic mesenchymal phenotypes. By contrast, H19-knockdown cells exhibited a substantial reduction of β1-integrin expression but elevated expression of CD24 relative to Sc cells (Figure 6F), suggesting that H19-knockdown cells are more epithelial-cell-like and less metastatic than Sc cells. Taken together, these results support our proposal that H19 contributes to cell adhesion by regulating both the transition of epithelial cancer cells to a mesenchymal state and integrin expression.
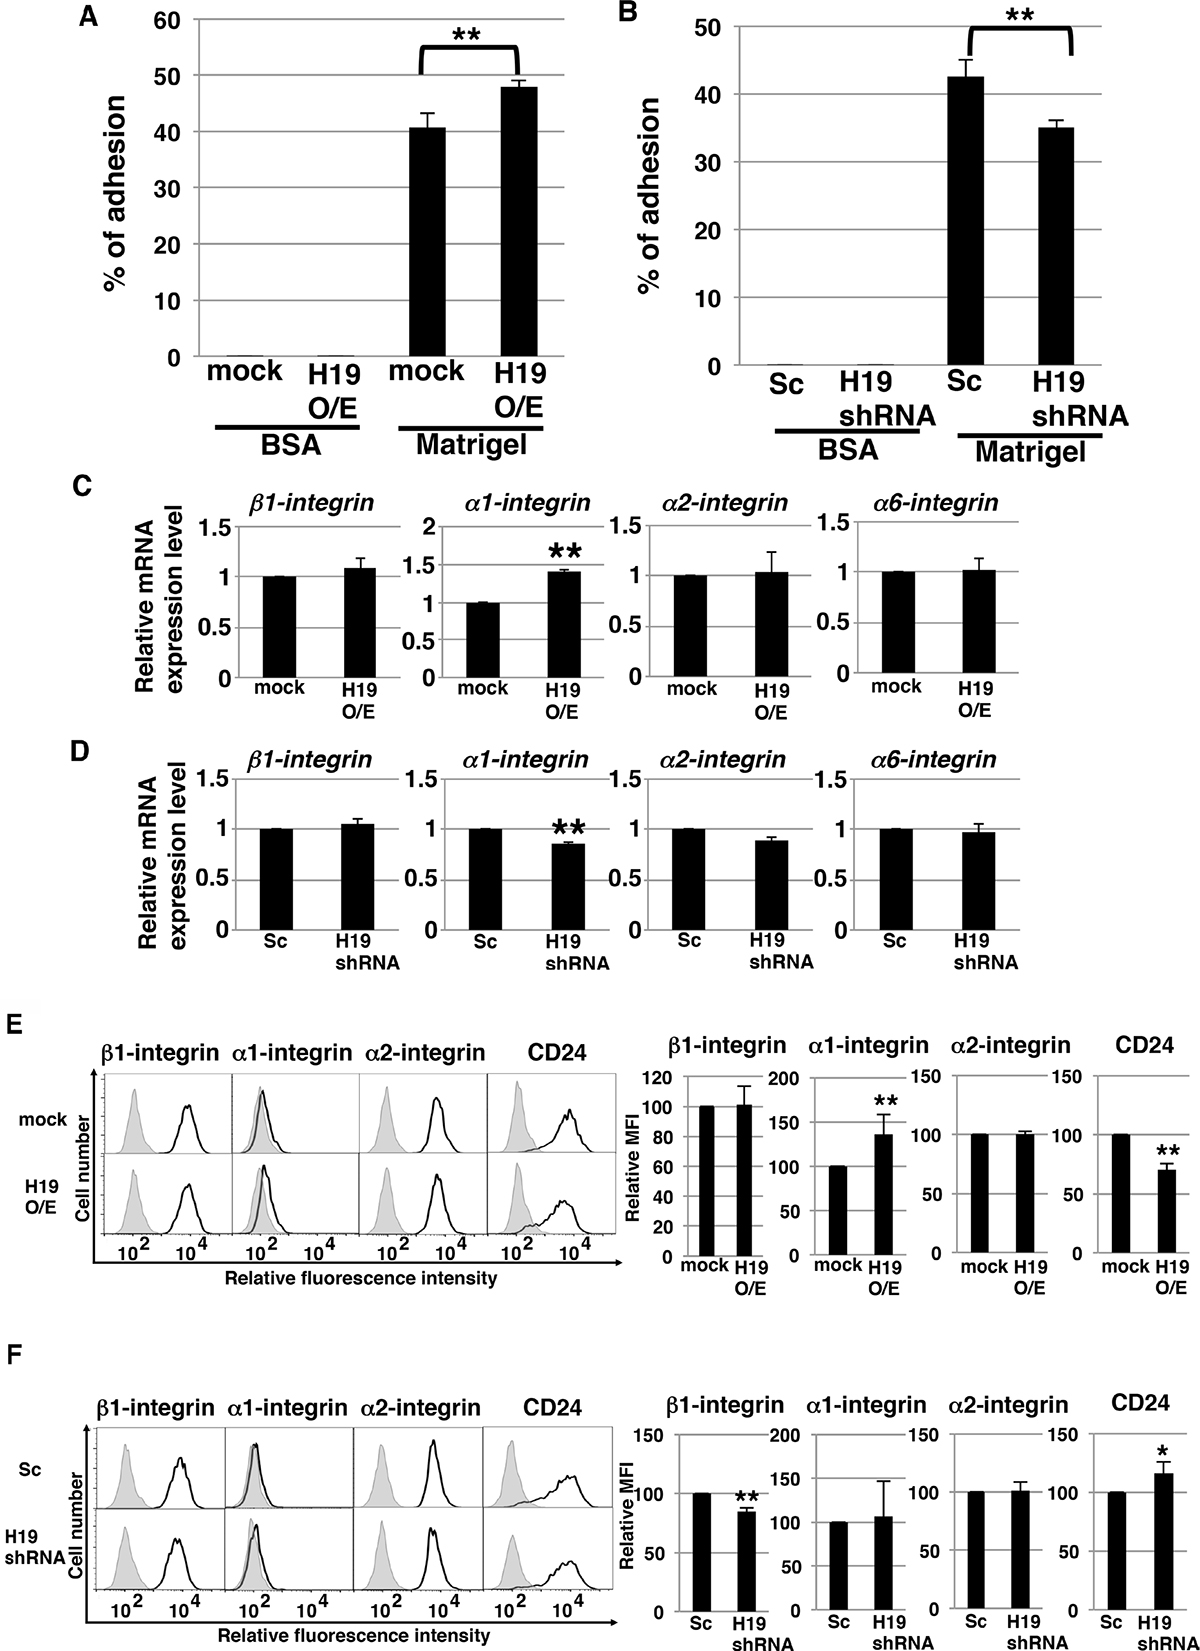
Figure 6: H19 contributes to cell adhesion through regulation of CD24 and integrin expression in PDAC cells. (A and B) Adhesion assays were performed using mock and H19-overexpressing cells (A) or Sc and H19-knockdown cells (B). Each cell type exhibited negligible adhesion to BSA. **P < 0.01. (C and D) qRT-PCR analysis of integrins was performed using cDNA derived from mock and H19-overexpressing cells (C) or Sc and H19-knockdown cells (D). Results are presented as means ± SD from three independent experiments. **P < 0.01. (E and F) Flow-cytometry analysis of integrin and CD24 levels in mock and H19-overexpressing cells (E) or Sc and H19-knockdown cells (F). Controls are indicated by thin lines with gray color. MFIs relative to mock or Sc cells are shown on the right side. Results are presented as means ± SD from three independent experiments. *P < 0.05, **P < 0.01.
Blocking β1-integrin inhibits sphere formation and invasion in H19-overexpressing cells
Sphere formation was higher in H19-overexpressing cells than mock cells (Figure 2B), but the underlying mechanism is unknown. Because our results showed that H19 promotes cell adhesion by regulating integrin expression (Figure 6), we hypothesized that the increased sphere formation by H19-overexpressing cells depends on integrin-mediated cell adhesion. To test this, we included an anti-β1-integrin blocking antibody in cell-cell adhesion assays and sphere-formation assays to supress integrin-mediated adhesion; cell-cell adhesion assays revealed that the increased adhesion exhibited by H19-overexpressing cells was inhibited by the blocking antibody (Figure 7A), indicating that the enhanced cell-cell adhesiveness was dependent on β1-integrin. Furthermore, the blocking antibody inhibited the increased sphere formation observed with H19-overexpressing cells (Figure 7B), which indicates that H19 contributes to sphere formation through integrin-mediated cell adhesion.
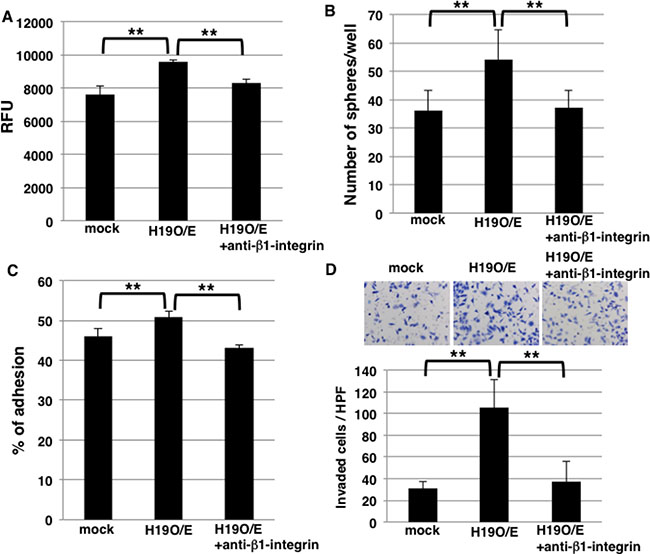
Figure 7: Blocking of β1-integrin inhibits sphere formation and invasion in H19-overexpressing cells. (A) Cell-cell adhesion assays were performed on mock and H19-overexpressing cells, with or without anti-β1-integrin antibody treatment. Adherent cells were indicated by RFU (relative fluorescence units). **P < 0.01. (B) Results of sphere-formation assays showing that the formation of an increased number of spheres by H19-overexpressing cells was inhibited by anti-β1-integrin antibody treatment. **P < 0.01. (C) Adhesion assays were performed on mock and H19-overexpressing cells, with or without anti-β1-integrin antibody treatment. **P < 0.01. (D) Matrigel invasion assays were performed on mock and H19-overexpressing cells, with or without anti-β1-integrin antibody treatment. **P < 0.01.
Lastly, to clarify whether H19 positively regulates invasion by modulating integrin expression, we quantified invasion by using H19-overexpressing cells treated with the anti-β1-integrin blocking antibody. Adhesion assays on Matrigel revealed that the increased adhesion exhibited by H19-overexpressing cells was inhibited by the blocking antibody (Figure 7C), which indicates that the enhanced adhesiveness of these cells depends on β1-integrin. Furthermore, the increased invasion shown by H19-overexpressing cells was also inhibited by the anti-β1-integrin blocking antibody (Figure 7D). These results indicate that H19 contributes to invasion through the regulation of β1-integrin-mediated cell adhesion.
EMT induction in H19-knockdown PDAC cells
H19 has been reported to play a role in epithelial to mesenchymal transition (EMT), which is the initial key process required for tumor metastasis in certain cancer cells [35–37]. However, no study thus far has clarified the contribution of H19 to the EMT of PDAC cells. As discussed in the preceding sections, our results demonstrated H19 involvement in EMT-like behaviors such as cell adhesion and invasion. We therefore investigated whether H19 plays a role in the EMT of PDAC cells. qRT-PCR analysis revealed that H19 expression was increased in Sc cells, but not H19-knockdown cells, after treatment with even comparatively lower concentrations of transforming growth factor-β1 (TGF-β1) (2 ng/mL) (Figure 8A), and EMT-marker expression was confirmed to be substantially altered in PANC-1 cells treated with TGF-β1 at various concentrations (0.5–4 ng/mL) (unpublished data); this suggested the involvement of H19 in EMT. However, the decrease in E-CADHERIN and increase in other EMT markers were comparable in Sc and H19-knockdown cells (Figure 8B). Based on these results, we propose two reasons for the lack of a major contribution of H19 in the EMT of PDAC cells: one, TGF-β1 signaling is functionally independent from H19 contribution; and two, the effect of TGF-β1 signaling predominates when compared with the effect of H19 in PDAC.
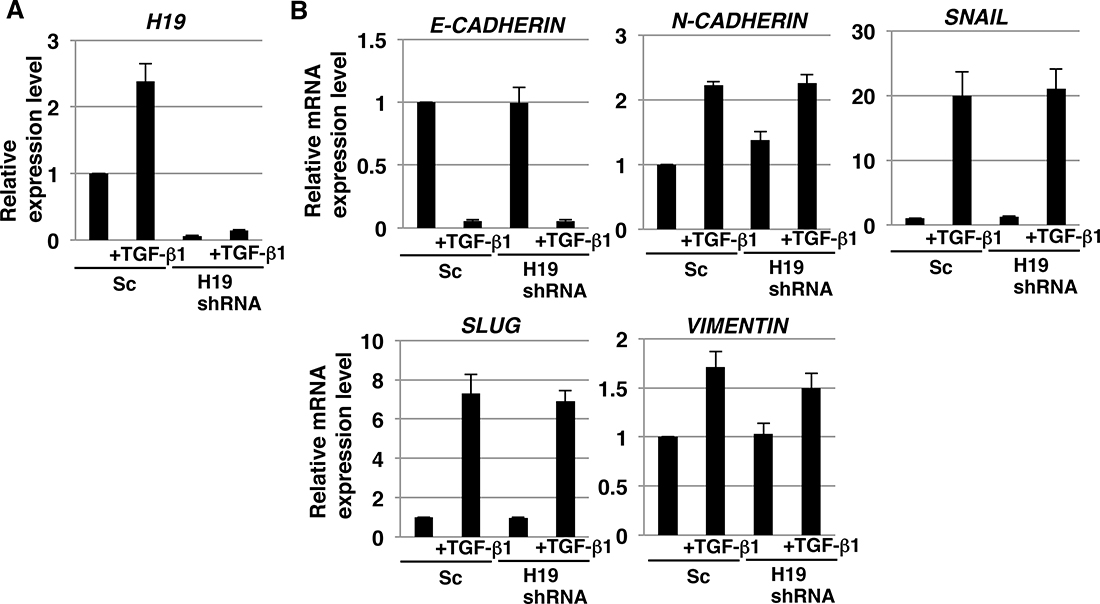
Figure 8: EMT induction in H19-knockdown PDAC cells. qRT-PCR analysis of H19 (A) and EMT markers (B) performed using cDNA derived from Sc and H19-knockdown cells after EMT induction. Results are normalized relative to values obtained for non-treated Sc cells (value = 1). Results are presented as means ± SD from three independent experiments.
H19-knockdown effect on PK-59 PDAC cells
As shown above, from among the available PDAC cell lines we used PANC-1 to demonstrate the molecular mechanisms of H19. We also tested the mechanism of H19 in other PDAC cells. Among human PDAC cell lines, we found that H19 expression in PK-59 was about 8 times higher than in PANC-1 cells (Figure 9A). Following knockdown of H19 in PK-59 cells, we performed several experiments. qRT-PCR analysis confirmed decreased H19 expression in H19-knockdown PK-59 cells (Figure 9B). In these cells, sphere formation was significantly decreased (Figure 9C), as were cell adhesion to Matrigel and invasion (Figure 9D and 9E). Furthermore, H19-knockdown PK-59 cells exhibited a substantial reduction of β1- and α1-integrin expression but elevated expression of CD24 relative to Sicont cells (Figure 9F). Thus, the majority of these results were consistent with the results of PANC-1 cells, indicating that H19 contributes to sphere formation and invasion by regulating integrin and CD24 expression in PDAC cells.
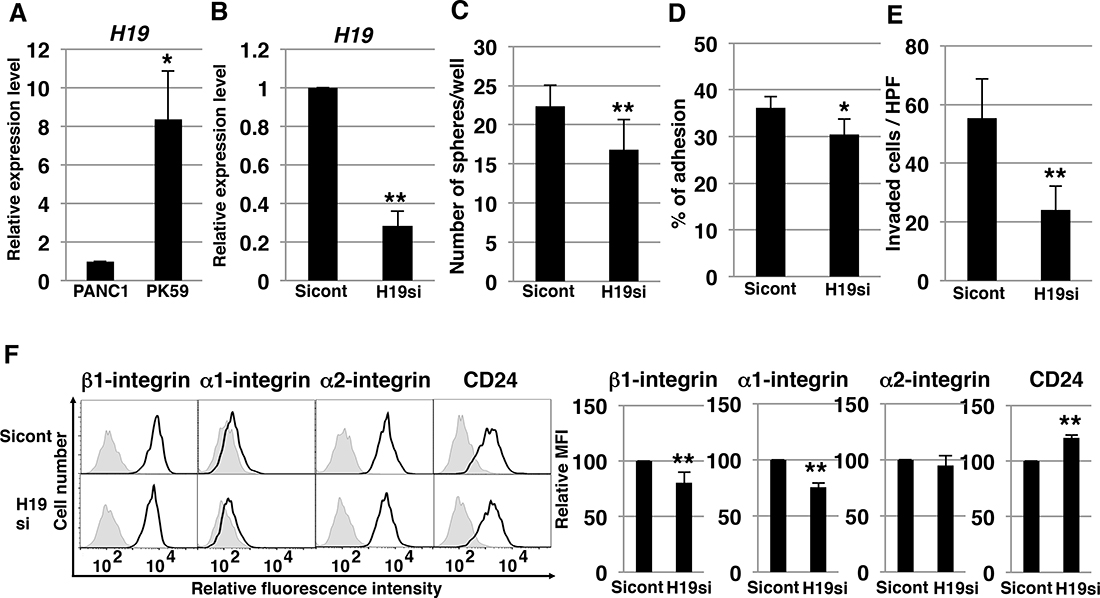
Figure 9: H19-knockdown effect on PK-59 PDAC cells. (A) qRT-PCR analysis of H19 was performed using cDNA derived from PANC-1 and PK-59 cells. *P < 0.05. (B) qRT-PCR analysis of H19 was performed using cDNA derived from Sicont and H19-knockdown (H19si) PK-59 cells. Results are normalized relative to the values obtained for sicont cells (value = 1). **P < 0.01. (C) Results of sphere-formation assays showing decreased sphere formation by H19-knockdown (H19si) PK-59 cells. **P < 0.01. (D) Adhesion assays were performed on Sicont and H19-knockdown (H19si) PK-59 cells. *P < 0.05. (E) Matrigel invasion assays were performed on Sicont and H19-knockdown (H19si) PK-59 cells. **P < 0.01. (F) Flow-cytometry analysis of integrin and CD24 levels in Sicont and H19-knockdown (H19si) PK-59 cells. Controls are indicated by thin lines with gray color. MFIs relative to Sicont cells are shown on the right side. Results are presented as means ± SD from three independent experiments. **P < 0.01.
DISCUSSION
H19 involvement in invasion and/or metastasis has been demonstrated in several cancers. We previously reported that in pancreatic cancer, inhibition of H19 reduced cancer metastasis in vivo [25], which demonstrated that H19 promotes the metastasis of PDAC cells. However, the molecular mechanisms underlying H19 contribution to PDAC-cell metastasis have remained unknown thus far. In this study, we showed that H19 contributes to sphere formation in PDAC cells, but not to stemness-marker expression and anticancer-drug resistance, and further promotes invasion by regulating integrin and CD24 expression in PDAC cells.
To date, several studies have reported a correlation between H19 and stemness. In normal prostate cells, H19 promotes the expression of stemness markers [38]. Furthermore, H19 supports sphere formation in breast cancer cells [19, 39], as well as transporter expression and anti-cancer-drug resistance in hepatocellular carcinoma cells [40]. Here, we showed that in PDAC cells, H19 promotes sphere formation, but not stemness-marker expression or transporter expression and anti-cancer-drug resistance. Although further studies are required to clarify this matter, we speculate that the involvement of H19 differs among cancer cell types due to the existing balance in the expression of H19, its target gene and proteins, and micro-RNAs. The results of in situ hybridization and qRT-PCR analysis suggested that H19 is highly expressed in the PDAC CSC-like cells (Figure 1). Therefore, clarification of the specificity of H19 expression in CSCs could lead to the identification of a novel CSC marker in PDAC.
The involvement of H19 in cell adhesion and integrin expression in cancer cells has been reported in only a few previous studies. In endometrial carcinoma, H19 regulates the expression of the β5, β3, and α4 integrins, which presumably leads to enhanced motility and increased invasive potential of the cells [41]. In this study, we showed that H19 is involved in cell adhesion and integrin expression in PDAC cells. However, no currently-available evidence indicates that H19 contributes directly to the regulation of integrin expression at the mRNA or protein level. Therefore, to clarify the correlation between H19 and integrin expression, further studies, such as epigenomic analyses, are required.
Enhanced CD24 expression in various cancers, including PDAC, has been reported, and CD24 expression correlates with malignancy [42, 43]. Among PDAC cells, the cells that expressed CD24, CD44, and epithelial-specific antigen on their surface were identified as putative CSCs [44]. CD24 expression also regulates cell motility and invasion [45, 46] and contributes to the maintenance of the epithelial phenotype of PDAC cells [47]. Here, we showed for the first time that increased H19 expression leads to a reduction of cell-surface CD24, and that downregulation of H19 helps maintain cell-surface CD24 expression. Therefore, we propose that H19 contributes to cell invasion by regulating CD24 expression. In a previous report [48], CD24 expression was shown to correlate with high invasive ability in PDAC cells. By contrast, we showed that H19-overexpressing PDAC cells, which are highly invasive, exhibited a reduction of CD24 expression. Therefore, further investigation is necessary to clarify the functional effect of H19 on CD24 expression and on invasiveness through regulation of CD24 expression. In breast cancer, CD24 is negative in CSCs, and CD24-negative cells are tumorigenic and invasive [49, 50]. From our results, we speculate that the overexpression of H19 in malignant CSCs of breast cancer contributes to reduction in CD24 expression and causes the invasive phenotype. In contrast, H19 expression is normally lowered in CD24-positive CSCs in PDACs, but is induced during transformation from the epithelial to the mesenchymal state, and CD24 is reduced in the cells which change to the invasive phenotype.
In conclusion, we have demonstrated that H19 contributes to sphere formation and invasion by regulating integrin and CD24 expression in PDAC cells, thus presumably leading to liver and lung metastasis (Figure 10). Therefore, H19 expression in PDAC is correlated with malignancy potential, and elimination of H19-expressing cells might represent a novel therapeutic option for PDAC. Further studies are required to clarify the characteristics of H19-expressing cells in PDAC, as well as to develop agents that eliminate H19-expressing cells for the treatment of PDAC. Specifically, the cell-surface characteristics of H19-expressing cells could be useful for the detection and elimination of H19-expressing cells. For example, a specific antigen present in H19-expressing cells might serve as a novel biomarker of malignant CSCs and could be applied to the development of therapeutic-antibody drugs and photoimmunotherapy in PDAC.
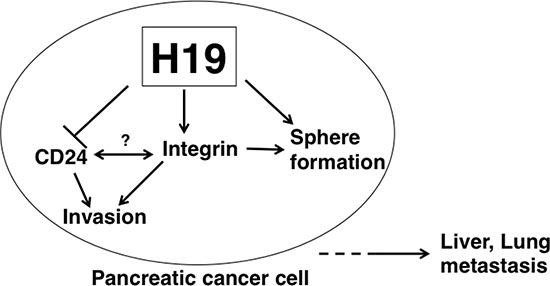
Figure 10: Model depicting H19 role in promoting PDAC-cell metastasis. In H19-expressing PDAC cells, sphere formation and cell invasion are enhanced. H19 is suggested to directly or indirectly contribute to CD24 and integrin expression. Interactions between CD24 and integrin are possible according to previously reported results [51]. H19-mediated downregulation of CD24 and upregulation of integrin are considered to induce an EMT-like phenotype, such as the enhanced cell adhesion resulting in a high invasive ability of PDAC cells. Collectively, our findings suggest that induction of the EMT-like phenotype by H19 leads to liver or lung metastasis.
MATERIALS AND METHODS
Cell culture
The human PDAC cell lines PANC-1 and PK-59 were obtained from the Cell Resource Center for Biomedical Research, Institute of Development, Aging and Cancer, Tohoku University (Sendai, Japan). PANC-1 and PK-59 cells were grown in growth medium (RPMI 1640 medium containing 10% fetal bovine serum) at 37° C under a humidified 5% CO2 atmosphere. For EMT induction, cells were cultured for 72 h in growth medium containing 2 ng/mL TGF-β1 (Peprotech, Rocky Hill, NJ, USA). For 3D culture, cells (3.0 × 10³ cells/well) in growth medium were plated in 96-well ultra-low attachment plates (Thermo Fisher Scientific, Waltham, MA, USA). After 7 days, the spheres were aspirated using micropipettes and placed in microcentrifuge tubes for use in further experiments.
Generation of stable H19-overexpressing and H19-shRNA-expressing PANC-1 cells
The H19 full-length cDNA (2.3 kb) cloned into pcDNA3.1(-) vector (a generous gift from Dr. Eric Adriaenssens, Science and Technology, Lille 1 University, France) and empty vector were transfected into PANC-1 cells by using the FuGENE HD transfection reagent (Roche Diagnostics, Mannheim, Germany) according to the manufacturer’s instructions. Briefly, 2 × 10⁵ cells/mL were transfected with 5 μg of DNA by using FuGENE HD and then the cells were passaged and cultured with 1 mg/mL geneticin (Sigma-Aldrich Corporation, St. Louis, MO, USA) [25].
To construct the expression vector for human H19 shRNA, a DNA fragment flanked by BamHI and HindIII sites and containing the sense target sequence for H19 (5′-TCA TCA GCC CAA CAT CAA A-3′), the hairpin-loop sequence (5′-TAG TGC TCC TGG TTG-3′), and the antisense target sequence was synthesized and inserted into the pBAsi-hU6 Neo DNA vector. Similarly, a scrambled sequence (5′-TCT TAA TCG CGT ATA AGG C-3′) was used to construct the sham vector that served as the negative control. The H19 shRNA and scrambled shRNA vectors were transfected as described in the preceding paragraph.
Transfection of siRNA targeting H19
We used siRNA (5′-CCC UCU AGC UUG GAA AUG ATT-3′) targeting H19 RNA as shown in previous our report [25]. The cells were plated at a density of 2 × 10⁵ cells in 35-mm dishes and transfected 24 hours later with 5 nM of either siRNAs targeting H19 or Silencer negative control siRNA (sicont) using Lipofectamine™ RNAiMAX Transfection Reagent (Thermo Fisher Scientific) according to the manufacturer’s protocol. Each experiment was performed 72 hours after transfection.
Branched DNA in situ hybridization
Branched DNA in situ hybridization was performed according to the protocol provided with the ViewRNA ISH Tissue 1-Plex Assay Kit (Affymetrix, Inc., Santa Clara, CA, USA) [18, 25]. Briefly, sections of PANC-1-cell blocks were deparaffinized, boiled in Pretreatment Solution (1:100) for 10 min at 90–100° C, and digested with protease (1:100) for 10 min at 40° C, and then hybridized (3 h, 40° C) with the H19 probe set, GAPD probe set (positive control), or Escherichia coli K12 dapB probe set (negative control) (each diluted 1:40). After washing, the sections were hybridized with PreAmplifier probe (1:100) for 25 min at 40° C, washed, hybridized with Amplifier probe (1:100) for 15 min at 40° C, washed, and, lastly, hybridized with Label Probe conjugated to alkaline phosphatase (1:1000) for 15 min at 40° C. After washing, the sections were incubated with Fast Red substrate. Phase-contrast images were obtained using a BX-9000 microscope (KEYENCE, Osaka, Japan).
FACS analysis
Cells were harvested after treatment with Accutase® cell-detachment solution (Merck Millipore, Billerica, MA, USA), and the dissociated single cells were incubated with primary antibodies or fluorescein isothiocyanate (FITC)-conjugated antibodies diluted in FACS buffer (0.5% [w/v] bovine serum albumin [BSA] and 0.1% [w/v] sodium azide in PBS) for 30 min on ice. After washing, the cell suspension was incubated with Alexa Fluor® 488-conjugated secondary antibodies (Molecular Probes, Eugene, OR, USA) diluted in FACS buffer for 30 min on ice. Cell sorting and analysis were performed using a FACSAria™ Cell Sorter (Becton Dickinson, Franklin Lakes, NJ, USA). We used the following FITC-conjugated antibodies and primary antibodies: FITC-conjugated isotype control (Becton Dickinson), FITC-conjugated anti-α1-integrin (BioLegend, San Diego, CA, USA), FITC-conjugated anti-α2-integrin (BioLegend), anti-β1-integrin (Abcam, Cambridge, UK), and anti-CD24 (Santa Cruz Biotechnology, Dallas, TX, USA). Mean fluorescence intensities (MFIs) were obtained after subtracting the intensities of the controls.
qRT-PCR
Total RNA was isolated from cells by using an RNeasy plus mini kit (QIAGEN, Hilden, Germany) and subsequently reverse-transcribed using a ReverTra Ace® qPCR RT Kit (Toyobo, Osaka, Japan). Real-time PCR was performed using a Power Sybr® Green kit (Applied Biosystems, Foster City, CA, USA) and a StepOnePlus™ real-time PCR system (Applied Biosystems). As an internal control, β-actin was amplified. qRT-PCR analysis for H19 was performed using TaqMan Fast Universal PCR Master Mix (Life Technologies Corporation Carlsbad, CA, USA) and TaqMan Gene Expression Assays (Life Technologies), with 18 S rRNA serving as an internal control. Table 1 lists the primer sets used for real-time PCR.
Table 1: Primer sets used for real-time PCR
Gene |
Forward primer |
Reverse primer |
|---|---|---|
NANOG |
CCAAAGGCAAACAACCCACTT |
CGGGACCTTGTCTTCCTTTTT |
SOX2 |
TGCGAGCGCTGCACAT |
TCATGAGCGTCTTGGTTTTCC |
OCT4 |
GGAGGAAGCTGACAACAATGAAA |
GGCCTGCACGAGGGTTT |
NESTIN |
TCCTGCTGTAGATGCAGAGATCAG |
ACCCTGTGTCTGGAGCAGAGA |
CD24 |
TCCAACTAATGCCACCACCAA |
GACCACGAAGAGACTGGCTGTT |
CD44v9 |
AGCAGAGTAATTCTCAGAGCTT |
TGCTTGATGTCAGAGTAGAAGT |
MMP2 |
GCGGCGGTCACAGCTACTT |
TTCAGACTTTGGTTCTCCAGCTT |
MMP9 |
GGACGATGCCTGCAACGT |
GTACTTCCCATCCTTGAACAAATACA |
MT1MMP |
GAAGGATGGCAAATTCGTCTTC |
AGGGACGCCTCATCAAACAC |
β1-integrin |
TTGGATTCTCCAGAAGGTGGTT |
TCAGTGATCCACAAACTGCAACT |
α1-integrin |
TGCTCTCAATCAGACAAGGTTTG |
GAGATGAACAGCACGTCTGCTT |
α2-integrin |
TGCCCCGAGCACATCAT |
CGCAAATCCAAAGAGTTGACAA |
α6-integrin |
ACAGAAAGTGTGCATGGAGGAAA |
TGGGAATGGGACGCAGTT |
E-CADHERIN |
CCAGTGAACAACGATGGCATT |
TGCTGCTTGGCCTCAAAAT |
N-CADHERIN |
TGGGAATCCGACGAATGG |
GCAGATCGGACCGGATACTG |
SNAIL |
CCCCAATCGGAAGCCTAACT |
GCTGGAAGGTAAACTCTGGATTAGA |
SLUG |
TGCGGCAAGGCGTTTT |
TCTCCCCCGTGTGAGTTCTAA |
VIMENTIN |
TCCAAACTTTTCCTCCCTGAAC |
GGGTATCAACCAGAGGGAGTGA |
β-ACTIN |
GGTCATCACCATTGGCAATGAG |
TACAGGTCTTTGCGGATGTCC |
Anticancer-drug-resistance assays
Cells (3.0 × 10³ cells/well) in growth medium were plated in 96-well culture plates, and 1 day later, anticancer drugs were added at 10 or 100 μM; at 4 days after plating, cell-growth rates were measured by means of ATP assays performed using a CellTiter-Glo® 2.0 Assay kit (Promega, Madison, WI, USA). Cell viability was calculated as the percentage of luminescence values in drug-treated cells relative to that in non-treated control cells.
Sphere-formation assays
To generate spheres, cells (1.0 × 10³ cells/well) in serum-free medium containing epidermal growth factor (20 ng/mL, R&D Systems, Inc. Westerville, OH, USA) and basic fibroblast growth factor (10 ng/mL, ReproCELL Inc. Kanagawa, Japan) were plated in 24-well ultra-low attachment plates (Corning Inc., Kennebunk, ME, USA). After 7 days, the spheres that formed were counted by using a phase-contrast microscope (Eclipse TS-100, Nikon, Tokyo, Japan).
Invasion assays
Cell-culture inserts (pore size: 8 μm; diameter: 6 mm) coated with Matrigel were used according to manufacturer instructions. Cells were plated at a density of 1 × 10⁵ cells/500 μL on the upper surface of the inserts, and 18 h later, the cells that had migrated through the membrane to the lower surface of the filter were fixed and stained with a Diff-Quick staining kit (Polysciences, Inc., Warrington, PA, USA) and then counted under a light microscope.
3D invasion assays
Cells (1.0 × 10³ cells/well) in growth medium were plated in 96-well ultra-low attachment plates. After incubation for 7 days, the growth medium was gently removed from the spheroid-containing plates and 100 μL of Matrigel solution in PBS containing 10 ng/mL TGF-β1 was gently dispensed into the U-bottom wells. The plates were incubated at 37° C for the Matrigel solution to solidify, and then 100 μL of growth medium was gently added to each well. The spheres were photographed using a phase-contrast microscope (Nikon) at appropriate incubation times.
MMP gelatin zymography
Medium collected from cells cultured in serum-free medium for 24 h at 37° C was concentrated using Amicon® Ultra Centrifugal Filters (Merck Millipore), and protein assays were performed. The same amounts of samples were resolved on 8% SDS-PAGE gels containing 4.0 mg/mL gelatin. The gels were rinsed with wash buffer (0.05 M Tris-HCl, pH 7.5, 5 mM CaCl2, 1 μM ZnCl2, 2.5% Triton X-100) and soaked in incubation buffer (0.05 M Tris-HCl, pH 7.5, 5 mM CaCl2, 1 μM ZnCl2, 1% Triton X-100) at 37° C for 24 h. After incubation, the gels were fixed and stained with Coomassie R-250, washed, and scanned.
Adhesion assays
For cell-adhesion assays, 96-well plates were coated with Matrigel (0.625 mg/mm2, Becton Dickinson) or 0.5% BSA in PBS for 30 min at 37° C, and then incubated with adhesion medium (0.5% BSA in serum-free RPMI 1640 medium) for 2 h at 37° C to block nonspecific binding. Cells were detached using Accutase® cell-detachment solution and resuspended in adhesion medium, then 5 × 10⁴ cells/well were added to plates, and they were incubated for 1 h. To remove non-adherent cells, the plates were washed twice with PBS. Bound cell numbers were determined through ATP assays performed using a CellTiter-Glo® 2.0 Assay kit. The percentage of adhesive cells was calculated as the percentage of luminescence values in adherent cells relative to that in total cells.
Cell-cell adhesion assays
Cells were detached using Accutase® cell-detachment solution and stained with Calcein-AM (PromoCell GmbH, Heidelberg, Germany). Following this, 5 × 10⁴ stain cells/well were added to 96-well plates, in which cells were grown to confluence, and incubated for 1 h. To remove non-adherent cells, the plates were washed twice with PBS. Next, bound cells were lysed with lysis buffer (Cell Biolabs, Inc., San Diego, CA, USA) and calcein fluorescence was measured.
Statistical analysis
Quantitative data are presented as means ± standard deviation (SD). Differences between two groups were analyzed using the two-tailed Student’s t test. Differences were considered significant at P < 0.05. Computations were performed using Microsoft Excel 2010 (Microsoft Corporation, Redmond, WA, USA).
Abbreviations
BSA: bovine serum albumin; CSC: cancer stem cell; EMT: epithelial to mesenchymal transition; FACS: fluorescence-activated cell sorting; FITC: fluorescein isothiocyanate; lncRNAs: long ncRNAs; MFIs: mean fluorescence intensities; MMP: matrix metalloproteinase; ncRNAs: non-coding RNAs; PBS: phosphate-buffered saline; PDAC: pancreatic ductal adenocarcinoma; qRT-PCR: quantitative reverse transcription-polymerase chain reaction; Sc: scrambled sequence transfected shRNA; SD: standard deviation; sh: short hairpin; TGF-β1: transforming growth factor-β1.
Author contributions
NS designed and performed experiments, analyzed data, and wrote the paper. HY performed in situ experiments. MT designed the study and drafted the manuscript. YM, TA, JA, and KT contributed to data interpretation and critically reviewed the manuscript. TI designed experiments and wrote the paper. All authors read and approved the final version of the manuscript.
ACKNOWLEDGMENTS
The authors thank Dr. Naoshi Ishikawa (Tokyo Metropolitan Institute of Gerontology) and Dr. Masaki Michishita (Nippon Veterinary and Life Science University) for their helpful discussion.
CONFLICTS OF INTEREST
There are no conflicts of interest to declare.
FUNDING
This work was supported by JSPS KAKENHI Grant Numbers 16K10613 and 16K08263 (Grants-in-Aid for Scientific Research (C)), by the project “Development of Cell Manufacturing and Processing Systems for Commercialization of Regenerative Medicine” from Japan Agency for Medical Research and Development, and by Daiwa Securities Health Foundation.
REFERENCES
1. Siegel RL, Miller KD, Jemal A. Cancer statistics, 2017. CA Cancer J Clin. 2017; 67:7–30.
2. Siegel RL, Miller KD, Jemal A. Cancer statistics, 2016. CA Cancer J Clin. 2016; 66:7–30.
3. Rahib L, Smith BD, Aizenberg R, Rosenzweig AB, Fleshman JM, Matrisian LM. Projecting cancer incidence and deaths to 2030: the unexpected burden of thyroid, liver, and pancreas cancers in the United States. Cancer Res. 2014; 74:2913–2921.
4. Jemal A, Siegel R, Ward E, Hao Y, Xu J, Murray T, Thun MJ. Cancer statistics, 2008. CA Cancer J Clin. 2008; 58:71–96.
5. Zhang H, Chen Z, Wang X, Huang Z, He Z, Chen Y. Long non-coding RNA: a new player in cancer. J Hematol Oncol. 2013; 6:37.
6. Shi X, Sun M, Liu H, Yao Y, Song Y. Long non-coding RNAs: A new frontier in the study of human diseases. Cancer Lett. 2013; 339:159–166.
7. McManus MT, Sharp PA. Gene silencing in mammals by small interfering RNAs. Nat Rev Genet. 2002; 3:737–747.
8. Kopp F, Mendell JT. Functional classification and experimental dissection of long noncoding RNAs. Cell. 2018; 172:393–407.
9. Sana J, Faltejskova P, Svoboda M, Slaby O. Novel classes of non-coding RNAs and cancer. J Transl Med. 2012; 10:103.
10. Qi P, Du X. The long non-coding RNAs, a new cancer diagnostic and therapeutic gold mine. Mod Pathol. 2013; 26:155–165.
11. Gabory A, Jammes H, Dandolo L. The H19 locus: Role of an imprinted non-coding RNA in growth and development. Bioessays. 2010; 32: 473–480.
12. Yoshimura H, Matsuda Y, Yamamoto M, Kamiya S, Ishiwata T. Expression and role of long non-coding RNA H19 in carcinogenesis. Front Biosci. 2018; 23:614–625.
13. Luo M, Li Z, Wang W, Zeng Y, Liu Z, Qiu J. Long non-coding RNA H19 increases bladder cancer metastasis by associating with EZH2 and inhibiting E-cadherin expression. Cancer Lett. 2013; 333:213–221.
14. Zhu Z, Xu L, Wan Y, Zhou J, Fu D, Chao H, Bao K, Zeng T. Inhibition of E-cadherin expression by lnc-RNA H19 to facilitate bladder cancer metastasis. Cancer Biomark. 2018; 22:275–281. https://doi.org/10.3233/CBM-170998.
15. Shi Y, Wang Y, Luan W, Wang P, Tao T, Zhang J, Qian J, Liu N, You Y. Long non-coding RNA H19 promotes glioma cell invasion by deriving miR-675. PLoS One. 2014; 9:e86295.
16. Zhao J, Ma ST. Downregulation of lncRNA H19 inhibits migration and invasion of human osteosarcoma through the NF-κB pathway. Mol Med Rep. 2018; 17:7388–7394.
17. Zhang TJ, Zhou JD, Zhang W, Lin J, Ma JC, Wen XM, Yuan Q, Li XX, Xu ZJ, Qian J. H19 overexpression promotes leukemogenesis and predicts unfavorable prognosis in acute myeloid leukemia. Clin Epigenetics. 2018; 10:47.
18. Matouk IJ, Raveh E, Abu-lail R, Mezan S, Gilon M, Gershtain E, Birman T, Gallula J, Schneider T, Barkali M, Richler C, Fellig Y, Sorin V, et al. Oncofetal H19 RNA promotes tumor metastasis. Biochim Biophys Acta. 2014; 1843:1414–1426.
19. Shima H, Kida K, Adachi S, Yamada A, Sugae S, Narui K, Miyagi Y, Nishi M, Ryo A, Murata S, Taniguchi H, Ichikawa Y, Ishikawa T, et al. Lnc RNA H19 is associated with poor prognosis in breast cancer patients and promotes cancer stemness. Breast Cancer Res Treat. 2018; 170:507–516. https://doi.org/10.1007/s10549-018-4793-z.
20. Huang Z, Lei W, Hu HB, Zhang H, Zhu Y. H19 promotes non-small-cell lung cancer (NSCLC) development through STAT3 signaling via sponging miR-17. J Cell Physiol. 2018; 233:6768–6776. https://doi.org/10.1002/jcp.26530.
21. Li H, Yu B, Li J, Su L, Yan M, Zhu Z, Liu B. Overexpression of lncRNA H19 enhances carcinogenesis and metastasis of gastric cancer. Oncotarget. 2014; 5:2318–2329. https://doi.org/10.18632/oncotarget.1913.
22. Ma C, Nong K, Zhu H, Wang W, Huang X, Yuan Z, Ai K. H19 promotes pancreatic cancer metastasis by derepressing let-7’s suppression on its target HMGA2-mediated EMT. Tumour Biol. 2014; 35:9163–9169.
23. Zhang L, Yang F, Yuan JH, Yuan SX, Zhou WP, Huo XS, Xu D, Bi HS, Wang F, Sun SH. Epigenetic activation of the MiR-200 family contributes to H19-mediated metastasis suppression in hepatocellular carcinoma. Carcinogenesis. 2013; 34:577–586.
24. Zhu M, Chen Q, Liu X, Sun Q, Zhao X, Deng R, Wang Y, Huang J, Xu M, Yan J, Yu J. lncRNA H19/miR-675 axis represses prostate cancer metastasis by targeting TGFBI. FEBS J. 2014; 281:3766–3775.
25. Yoshimura H, Matsuda Y, Yamamoto M, Michishita M, Takahashi K, Sasaki N, Ishikawa N, Aida J, Takubo K, Arai T, Ishiwata T. Reduced expression of the H19 long non-coding RNA inhibits pancreatic cancer metastasis. Lab Invest. 2018; 98:814–824. https://doi.org/10.1038/s41374-018-0048-1.
26. Sasaki N, Ishiwata T, Hasegawa F, Michishita M, Kawai H, Matsuda Y, Arai T, Ishikawa N, Aida J, Takubo K, Toyoda M. Stemness and anti-cancer drug resistance in ATP-binding cassette subfamily G member 2 highly expressed pancreatic cancer is induced in 3D culture conditions. Cancer Sci. 2018; 109:1135–1146.
27. Reya T, Morrison SJ, Clarke MF, Weissman IL. Stem cells, cancer, and cancer stem cells. Nature. 2001; 414:105–111.
28. Egeblad M, Werb Z. New functions for the matrix metalloproteinases in cancer progression. Nat Rev Cancer. 2002; 2:161–174.
29. Zervos EE, Shafii AE, Haq M, Rosemurgy AS. Matrix metalloproteinase inhibition suppresses MMP-2 activity and activation of PANC-1 cells in vitro. J Surg Res. 1999; 84:162–167.
30. Bloomston M, Zervos EE, Rosemurgy AS. Matrix metalloproteinases and their role in pancreatic cancer: A review of preclinical studies and clinical trials. Ann Surg Oncol. 2002; 9:668–674.
31. Pickup MW, Mouw JK, Weaver VM. The extracellular matrix modulates the hallmarks of cancer. EMBO Rep. 2014; 15:1243–1253.
32. Hynes RO. Integrins: bidirectional, allosteric signaling machines. Cell. 2002; 110:673–687.
33. Sawai H, Funahashi H, Yamamoto M, Okada Y, Hayakawa T, Tanaka M, Takeyama H, Manabe T. Interleukin-1α enhances integrin α6β1 expression and metastatic capability of human pancreatic cancer. Oncology. 2003; 65:167–173.
34. Sawai H, Funahashi H, Matsuo Y, Yamamoto M, Okada Y, Hayakawa T, Manabe T. Expression and prognostic roles of integrins and interleukin-1 receptor type I in patients with ductal adenocarcinoma of the pancreas. Dig Dis Sci. 2003; 48:1241–1250.
35. Raveh E, Matouk IJ, Gilon M, Hochberg A. The H19 Long non-coding RNA in cancer initiation, progression and metastasis – a proposed unifying theory. Mol Cancer. 2015; 14:184.
36. Li J, Huang Y, Deng X, Luo M, Wang X, Hu H, Liu C, Zhong M. Long noncoding RNA H19 promotes transforming growth factor-β-induced epithelial-mesenchymal transition by acting as a competing endogenous RNA of miR-370-3p in ovarian cancer cells. Onco Targets Ther. 2018; 11:427–440.
37. Zhang Q, Li X, Li X, Li X, Chen Z. LncRNA H19 promotes epithelial-mesenchymal transition (EMT) by targeting miR-484 in human lung cancer cells. J Cell Biochem. 2018; 119:4447–4457.
38. Bauderlique-Le Roy H, Vennin C, Brocqueville G, Spruyt N, Adriaenssens E, Bourette RP. Enrichment of human stem-like prostate cells with s-SHIP promoter activity uncovers a role in stemness for the long noncoding RNA H19. Stem Cells Dev. 2015; 24:1252–1262.
39. Lottin S, Adriaenssens E, Dupressoir T, Berteaux N, Montpellier C, Coll J, Dugimont T, Curgy JJ. Overexpression of an ectopic H19 gene enhances the tumorigenic properties of breast cancer cells. Carcinogenesis. 2002; 23:1885–1895.
40. Tsang WP, Kwok TT. Riboregulator H19 induction of MDR1-associated drug resistance in human hepatocellular carcinoma cells. Oncogene. 2007; 26:4877–4881.
41. Smolle MA, Bullock MD, Ling H, Pichler M, Haybaeck J. Long non-coding RNAs in endometrial carcinoma. Int J Mol Sci. 2015; 16:26463–26472.
42. Aigner S, Sthoeger ZM, Fogel M, Weber E, Zarn J, Ruppert M, Zeller Y, Vestweber D, Stahel R, Sammar M, Altevogt P. CD24, a mucin-type glycoprotein, is a ligand for P-selectin on human tumor cells. Blood. 1997; 89:3385–3395.
43. Yang XR, Xu Y, Yu B, Zhou J, Li JC, Qiu SJ, Shi YH, Wang XY, Dai Z, Shi GM, Wu B, Wu LM, Yang GH, et al. CD24 is a novel predictor for poor prognosis of hepatocellular carcinoma after surgery. Clin Cancer Res. 2009; 15:5518–5527.
44. Li C, Heidt DG, Dalerba P, Burant CF, Zhang L, Adsay V, Wicha M, Clarke MF, Simeone DM. Identification of pancreatic cancer stem cells. Cancer Res. 2007; 67:1030–1037.
45. Baumann P, Cremers N, Kroese F, Orend G, Chiquet-Ehrismann R, Uede T, Yagita H, Sleeman JP. CD24 expression causes the acquisition of multiple cellular properties associated with tumor growth and metastasis. Cancer Res. 2005; 65:10783–10793.
46. Sagiv E, Starr A, Rozovski U, Khosravi R, Altevogt P, Wang T, Arber N. Targeting CD24 for treatment of colorectal and pancreatic cancer by monoclonal antibodies or small interfering RNA. Cancer Res. 2008; 68:2803–2812.
47. Lubeseder-Martellato C, Hidalgo-Sastre A, Hartmann C, Alexandrow K, Kamyabi-Moghaddam Z, Sipos B, Wirth M, Neff F, Reichert M, Heid I, Schneider G, Braren R, Schmid RM, Siveke JT. Membranous CD24 drives the epithelial phenotype of pancreatic cancer. Oncotarget. 2016; 7:49156–49168. https://doi.org/10.18632/oncotarget.9402.
48. Kitaura Y, Chikazawa N, Tasaka T, Nakano K, Tanaka M, Onishi H, Katano M. Transforming growth factor β1 contributes to the invasiveness of pancreatic ductal adenocarcinoma cells through the regulation of CD24 expression. Pancreas. 2011; 40:1034–1042.
49. Al-Hajj M, Wicha MS, Benito-Hernandez A, Morrison SJ, Clarke MF. Prospective identification of tumorigenic breast cancer cells. Proc Natl Acad Sci U S A. 2003; 100:3983–3988.
50. Sheridan C, Kishimoto H, Fuchs RK, Mehrotra S, Bhat-Nakshatri P, Turner CH, Goulet R Jr, Badve S, Nakshatri H. CD44+/CD24− breast cancer cells exhibit enhanced invasive properties: An early step necessary for metastasis. Breast Cancer Res. 2006; 8:R59.
51. Runz S, Mierke CT, Joumaa S, Behrens J, Fabry B, Altevogt P. CD24 induces localization of β1 integrin to lipid raft domains. Biochem Biophys Res Commun. 2008; 365:35–41.