
INTRODUCTION
Gastric cancer is still a severe public health problem worldwide, particularly in Eastern Asia [1]. While stage I gastric cancer may be curable by surgery alone, patients with advanced gastric cancer are at risk of death due to disease recurrence after initial tumor resection and failure to respond to subsequent chemotherapy [2, 3]. This underscores the importance of building a new risk stratification model for accurate prediction of prognosis, disease monitoring, and evaluation of treatment response.
Currently, endoscopy, and enhanced computed tomography are still the standard tests for diagnosing and staging gastric cancer [4, 5]. However, these are invasive procedures with a significant cost for patients. However, noninvasive serum tumor markers such as carcinoembryonic antigen (CEA) and carbohydrate antigen (CA) 19-9 are widely used in clinical practice, but have limited sensitivity and specificity, limiting their utility in decision making and management of patients with gastric cancer [6–8]. With the development of genomics, proteomics, and metabolomics, an increasing number of biomarkers have been identified and studied [9]. This holds promise that novel noninvasive markers with potential clinical value will be discovered to improve the management of gastric cancer [10]. However, due to the inherent heterogeneity of gastric cancer in terms of its biological and genetic characteristics, most individual markers have shown limited value in predicting differences in biology of the individual tumors and ultimately, in predicting clinical outcomes.
Recently, the concept of combining multiple markers has shifted the paradigm away from single gene analysis, providing more reliable insight into tumor biology, and yielding more robust oncological information. The Oncotype DX® Colon Cancer Assay (Genomic Health, Redwood City, CA, USA), for example, utilizes a quantitative reverse transcription-polymerase chain reaction (RT-PCR)-based panel test using 12 molecular markers and has been validated in large clinical trials as a significant predictor of recurrence in stage II colon cancer [11]. It is a good example of success in demonstrating that comprehensive characterization of individual patients’ tumors is key to realizing the potential of personalized therapeutic strategies [12]. Still, there is room for improvement in assay simplification associated with a reduction in technical requirements, cost, and time. Taking into account the clinical application, an ideal assay strikes a balance between accuracy and simplicity.
These realities prompted us to build a predictive model for gastric cancer risk assessment. The aim of this study was to develop a simple and accurate integrated multigene expression panel that can provide clinical guidance in determining the optimal treatment for gastric cancer.
RESULTS
Development of an integrated multigene expression panel
After randomized assignment of patients, there were no significant differences in patient characteristics between the learning and validation cohorts (Figure 1A and Supplementary Table 1). Concordance index (C-index) values of the 15 single candidate markers ranged from 0.506–0.653, and those of preoperative serum CEA (cutoff 5 ng/ml) and CA19-9 (cutoff 37 IU/ml) were 0.545 and 0.561, respectively (Figure 1B). C-index values of all single and combinations of the 15 candidate markers (neither CEA nor CA19-9 included) for overall survival were calculated and counted for 32,767 patterns. The highest C-index value among all combinations was 0.840, which was determined for the expression panel consisting of 13 markers (Figure 1C). The larger the number of markers included in the panel, the greater the number of subpopulations into which patients were clustered with a corresponding decrease in the minimal number of patients in a subpopulation. The subpopulation index rapidly decreased after the number of markers was ≥5 (Figure 1C). We decided that the optimal and balanced number of markers was four (C-index >0.75 and subpopulation index >45). The expression panel having the greatest C-index among combinations of four constituents comprised MAGED2, SYT8, BTG1, and FAM46, and the C-index value was 0.793 (Supplementary Table 2). The expression index was determined by weighting each marker using the coefficient, and then provisionally categorized into score 1 (expression index <40), score 2 (index 41–80), and score 3 (index ≥81). The scoring system clearly stratified patients into favorable, intermediate, and poor overall survival groups (Figure 2A), and none of the individual constituents of the expression panel (MAGED2, SYT8, BTG1, and FAM46) exhibited the equivalent stratifying performance compared with the multigene expression panel (Figure 2B). Based on these findings, the scoring system proceeded to the validation stage using another cohort.
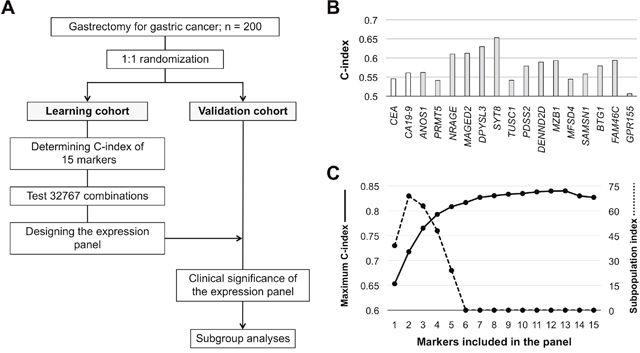
Figure 1: Development process of the integrated multigene expression panel. (A) Flowchart. (B) C-index values of the 15 candidate molecular markers and preoperative serum CEA and CA19-9 levels. (C) C-index values and the subpopulation index according to the number of markers included in the panel.
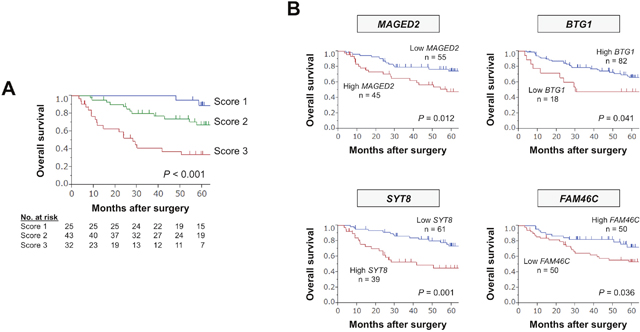
Figure 2: Predictive values of the expression panel and individual single markers in the learning cohort. (A) Overall survival of patients with expression scores 1, 2, and 3. (B) The prognostic value of each constituent.
Table 1: Association between expression scores and clinicopathological parameters in the validation set
Variables |
Score 1 (n = 11) |
Score 2 (n = 45) |
Score 3 (n = 44) |
P |
|---|---|---|---|---|
Age |
0.072 |
|||
< 70 years |
3 |
29 |
23 |
|
≥ 70 years |
8 |
16 |
21 |
|
Sex |
0.989 |
|||
Male |
8 |
32 |
31 |
|
Female |
3 |
13 |
13 |
|
CEA (ng/ml) |
0.085 |
|||
≤ 5 |
10 |
37 |
29 |
|
> 5 |
1 |
8 |
15 |
|
CA19-9 (IU/ml) |
0.136 |
|||
≤ 37 |
10 |
37 |
30 |
|
> 37 |
1 |
8 |
14 |
|
Tumor location |
||||
Entire |
1 |
0 |
8 |
|
Upper third |
3 |
10 |
6 |
0.026 |
Middle third |
4 |
13 |
10 |
|
Lower third |
3 |
22 |
20 |
|
Tumor size (mm) |
<0.001 |
|||
< 50 |
9 |
12 |
8 |
|
≥ 50 |
2 |
33 |
36 |
|
Tumor multiplicity |
0.485 |
|||
Solitary |
11 |
42 |
41 |
|
Multiple |
0 |
3 |
3 |
|
Tumor depth (UICC) |
0.058 |
|||
pT1 |
4 |
8 |
2 |
|
pT2 |
0 |
4 |
2 |
|
pT3 |
1 |
8 |
14 |
|
pT4 |
6 |
25 |
26 |
|
Histology |
0.157 |
|||
Well differentiated |
1 |
5 |
0 |
|
Moderately differentiated |
3 |
13 |
13 |
|
Poorly differentiated |
7 |
24 |
29 |
|
Signet ring cell |
0 |
2 |
0 |
|
Mucinous |
0 |
1 |
2 |
|
Differentiation |
0.581 |
|||
Differentiated |
4 |
18 |
13 |
|
Undifferentiated |
7 |
27 |
31 |
|
Lymphatic involvement |
0.197 |
|||
Absent |
3 |
6 |
3 |
|
Present |
8 |
39 |
41 |
|
Vascular invasion |
0.063 |
|||
Absent |
6 |
22 |
12 |
|
Present |
5 |
23 |
32 |
|
Infiltrative growth type |
0.177 |
|||
Invasive growth |
2 |
18 |
21 |
|
Expansive growth |
9 |
27 |
23 |
|
Lymph node metastasis |
||||
Absent |
5 |
19 |
4 |
<0.001 |
Present |
6 |
26 |
40 |
|
Peritoneal metastasis |
0.013 |
|||
Absent |
11 |
33 |
28 |
|
Present |
0 |
12 |
16 |
|
Synchronous hepatic metastasis |
||||
Absent |
11 |
45 |
39 |
0.014 |
Present |
0 |
0 |
5 |
|
UICC stage |
<0.001 |
|||
I |
4 |
11 |
1 |
|
II |
2 |
7 |
6 |
|
III |
5 |
15 |
14 |
|
IV |
0 |
12 |
23 |
CEA, carcinoembryonic antigen; CA19-9, carbohydrate antigen 19-9; UICC, Union for International Cancer Control.
Table 2: Prognostic factors for overall survival in patients who underwent curative resection in the validation cohort
Variables |
n |
Univariate |
Multivariate |
||||
|---|---|---|---|---|---|---|---|
Hazard ratio |
95% CI |
P |
Hazard ratio |
95% CI |
P |
||
Age (≥ 70) |
27 |
0.81 |
0.30–1.99 |
0.656 |
|||
Gender (male) |
20 |
1.36 |
0.53–4.19 |
0.541 |
|||
CEA (> 5 ng/ml) |
11 |
1.34 |
0.38–3.66 |
0.611 |
|||
CA19-9 (> 37 IU/ml) |
11 |
2.85 |
1.00–7.14 |
0.049 |
1.60 |
0.54–4.30 |
0.379 |
Tumor location (lower third) |
33 |
0.81 |
0.32–1.98 |
0.652 |
|||
Tumor size (≥ 50 mm) |
38 |
2.35 |
0.91–7.23 |
0.079 |
|||
Tumor depth (pT4, UICC) |
28 |
2.15 |
0.89–5.49 |
0.089 |
|||
Tumor differentiation (undifferentiated) |
39 |
1.38 |
0.56–3.67 |
0.488 |
|||
Lymphatic involvement |
55 |
4.10 |
0.85–73.6 |
0.087 |
|||
Vascular invasion |
35 |
6.00 |
2.01–25.7 |
<0.001 |
4.31 |
1.33–19.3 |
0.013 |
Invasive growth |
20 |
1.99 |
0.80–4.82 |
0.133 |
|||
Lymph node metastasis |
39 |
4.96 |
1.66–21.3 |
0.003 |
1.06 |
0.19–4.77 |
0.939 |
UICC stage (III) |
34 |
4.59 |
1.68–16.1 |
0.002 |
3.66 |
1.08–15.6 |
0.037 |
Expression score (3) |
21 |
3.68 |
1.49–9.12 |
0.005 |
3.18 |
1.19–8.62 |
0.021 |
CEA, carcinoembryonic antigen; CA19-9, carbohydrate antigen 19-9; UICC, Union for International Cancer Control.
Clinical significance of the integrated multigene expression panel
The reproducibility of the panel was evaluated in the validation cohort. The overall survival of patients with expression scores 1, 2, and 3 were clearly distinguished from each other (Figure 3A). No significant differences were found with respect to histology, tumor depth differentiation. In contrast, higher expression scores were significantly associated with larger tumor size, lymph node metastasis, peritoneal metastasis, hepatic metastasis, and advanced disease stage (Table 1).
When focused on patients who underwent curative gastrectomy (stage I–III gastric cancer), overall (Figure 3B) and disease-free survival rates (Figure 3C) gradually decreased with increasing expression score. Multivariable analysis revealed that expression score 3 was an independent prognostic factor for overall survival after curative gastrectomy (hazard ratio 3.18, 95% confidence interval 1.19–8.62, P = 0.021; Table 2). Overall recurrence rates and frequency of each recurrent pattern observed according to the expression score are depicted in Figure 3D. No patients with the score 1 experienced peritoneal and/or hepatic recurrences. In contrast, the prevalence of peritoneal recurrences showed a stepwise increase in proportion to the expression score (Figure 3D).
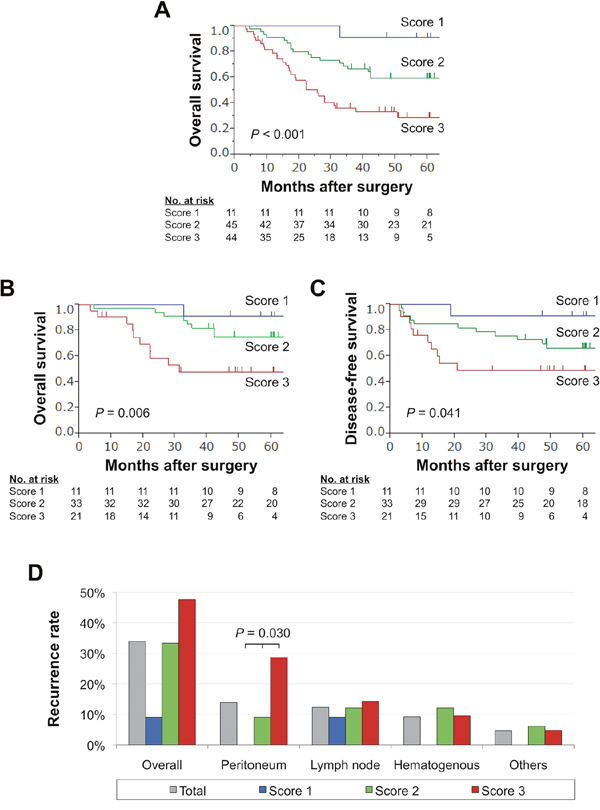
Figure 3: Prognostic impact of the expression panel in the validation cohort. (A) Overall survival of patients with expression scores 1, 2, and 3. (B) Overall survival of patients with stage I-III gastric cancer. (C) Disease-free survival of patients with expression scores 1, 2, and 3 after curative gastrectomy. (D) Frequency of sites of initial recurrence for each expression score.
DISCUSSION
In this study, we analyzed 32,767 patterns and built a new prognostic model, an integrated multigene expression panel that can clearly stratify patients into low, intermediate, and high risk after gastrectomy for gastric cancer. The advantages of the panel are manifested in the following ways: a novel panel comprising original molecular markers, results presented using a simple scoring system, high predictive value with respect to overall and disease-free survival, and, confirmed reproducibility as demonstrated in both the learning and validation cohorts.
A growing body of evidence has demonstrated that gastric cancer is a complex and heterogeneous disease with substantial variation in its molecular and clinical characteristics [13, 14]. Since it is unlikely that a single molecular marker can faithfully represent the various oncological signatures, more reliable and convenient prognostic models are required to enhance the long-term survival of patients with gastric cancer [9, 15]. Combining multiple independently predictive markers has been demonstrated to improve accuracy in large clinical trials for breast, prostate, and colorectal cancer; however, few studies have investigated the diagnostic efficacy of three-dimensional combined biomarkers for gastric cancer [16–18].
Given that our aim was to develop a simple and high-performance multigene expression panel, certain procedures were required to be followed. The larger the number of markers included in the panel, the greater the number of subpopulations into which patients were clustered with a corresponding decrease in the minimal number of patients in any given subpopulation. The subpopulation index was used to optimize the number of markers included in the panel, and inclusion of four markers was found to be the most objectively balanced system. To maximize performance of the expression panel, a weighting using the coefficient of each constituent was employed to determine the expression index for all patients [19]. Thereafter, patients were stratified based on their expression score (1 to 3) according to the expression index, which was a more straightforward patient stratification method compared with using continuous numeric variables. Considering that our attempt was certainly exploratory, the validation process was necessary to evaluate the validity of the procedure used in the development of the multigene expression panel. As a result, the predictive value of the panel was reproduced successfully in the validation set. The consistent findings give us confidence that the expression panel may have potential in the risk stratification of patients with gastric cancer.
The strength of the final panel is that candidate biomarkers used for the development of the panel have been previously validated biologically. The four constituents of the expression panel, MAGED2, SYT8, BTG1, and FAM46, have individual roles in gastric cancer progression. MAGED2 is a cell adherent molecule and belongs to the melanoma-associated antigen family, which plays important roles in cancer development, progression, and resistance to treatment [20, 21]. We reported that increased levels of tissue and serum MAGED2 were associated with distant metastasis in gastric cancer [22]. SYT8 encodes a single-pass membrane protein involved in membrane trafficking [23]. Elevated SYT8 levels were significantly and specifically associated with peritoneal metastasis, and intraperitoneal administration of an SYT8-specific small interfering RNA inhibited the growth of peritoneal nodules and prolonged survival in mouse xenograft models [24]. BTG1 reportedly is a mediator of B-cell differentiation and may act as a tumor suppressor because of its inhibitory effects on proliferation and cell cycle progression [25, 26]. In our previous study, downregulation of BTG1 was associated with larger tumor size and lymph node metastasis [27]. FAM46C is a signal transducer that stabilizes mRNA and is frequently mutated and downregulated in gastric cancer tissues [28]. We found that downregulation of FAM46C served as a predictive marker of hepatic recurrence after curative gastrectomy [29]. Since four different types of biomarkers have distinguishing features and contribute to metastatic patterns, they complementarily interacted with each other and contributed to the expression panel, having an improved predictive performance in gastric cancer, even though it is an extremely heterogeneous disease. Furthermore, use of our study concept can leverage current knowledge of single molecular markers and bring them to the next stage, which would be an important step forward in the realization of precision medicine.
To translate results of the present study to the clinic will involve discussion about how best to use the expression panel. Our findings highlight that the integrated multigene expression panel enables physicians to easily identify individuals expected to have an excellent prognosis (low risk), and conversely those expected to have an adverse outcome (high risk). For patients at low risk, avoidance of excessive intervention both in disease monitoring and treatment can reduce the burden for patients, as well as medical costs. In contrast, intensive systemic surveillance including enhanced computed tomography to detect signs of peritoneal, nodal or hepatic recurrences, and aggressive adjuvant therapy could be considered for patients at high risk. For patients at intermediate risk, standard management conformable to the treatment guidelines is recommended [30]. Patients who underwent curative gastrectomy are recognized as a delicate population characterized by varied prognosis (range from complete cure to early recurrence) that will likely benefit from accurate risk stratification. Therefore, for patents with resectable gastric cancer, the expression panel might merit inclusion as an adjustment factor or one of the endpoints in prospective clinical trials evaluating survival benefit of systemic adjuvant chemotherapy in gastric cancer [31]. In this study, expression levels were determined using surgically-resected gastric tissues. Since endoscopic biopsy samples are also available for mRNA analysis, expression scores can be determined before surgery and may contribute to decision-making regarding indication of perioperative treatment or surgery. Because the clinical utility of the expression panel to accurately predict patient outcomes is the ultimate goal, the present work should be viewed as an important first step but not as the definitive answer.
This study had some limitations. Despite an effort to reduce selection bias using a 2-step evaluation, the retrospective nature of the study, the relatively small cohort size, the usage of some old samples, and the long period of study may have biased the data. Although we designed a 2-step evaluation protocol of the predictive value of our integrated multigene expression panel, extra-validation and a prospective large-scale observational study will be required for the next step toward translation to the clinical practice. Although mRNA expression levels were used because they are easy to quantify objectively, the use of IHC could be considered given that it is a readily accessible and commonly used technique in clinical practice.
Taken together, we developed an integrated multigene expression panel for patients with gastric cancer that may maximize the predictive performance of each single marker, enable accurate risk stratification, and eventually contribute to personalized medicine in the field of surgical oncology.
MATERIALS AND METHODS
Patients, sample collection, and randomization
Primary gastric cancer tissues and corresponding noncancerous adjacent tissues were collected from 200 gastric cancer patients who underwent gastric resection without preoperative treatment at the Department of Gastroenterological Surgery, Nagoya University Hospital between 2001 and 2014. Tissue samples were collected, frozen immediately in liquid nitrogen, and stored at –80°C until used for RNA extraction (average 28 days). RNA was extracted from tumor samples with approximately 5 mm diameters that did not contain a necrotic component. Using a table of random numbers, 200 patients were divided into learning (n = 100) and validation cohorts (n = 100) in a 1:1 ratio. Markers to be included in the integrated expression panel were determined using the learning cohort, and the clinical predictive performance of the panel was subsequently evaluated in the validation cohort. This study conformed to the ethical guidelines of the Declaration of Helsinki and was approved by the Institutional Review Board of Nagoya University, Japan (approval number 2014-0043). Written informed consent for use of clinical samples and data, as required by the institutional review board, was obtained from all patients.
Molecular markers comprising the expression panel
From our recently published papers, 15 molecular markers were evaluated as candidate biomarkers (Table 3): anosmin-1 (ANOS1), protein arginine methyltransferase 5 (PRMT5), neurotrophin receptor-interacting melanoma antigen-encoding protein (NRAGE), melanoma antigen gene family member D2 (MAGED2), dihydropyrimidinase like 3 (DPYSL3), synaptotagmin VIII (SYT8), tumor suppressor candidate 1 (TUSC1), decaprenyl diphosphate synthase subunit 2 (PDSS2), DENN domain containing 2D (DENND2D), marginal zone B and B1 cell-specific protein (MZB1), major facilitator superfamily domain containing 4 (MFSD4), SAM domain, SH3 domain and nuclear localization signals 1 (SAMSN1), BTG anti-proliferation factor 1 (BTG1), family with sequence similarity 46, member C (FAM46C), and G protein-coupled receptor 155 (GPR155). Quantitative real-time RT-PCR (qRT-PCR) was performed to determine mRNA expression levels, as described previously [22, 24, 27, 29, 32-42]. Sequences of specific primers are listed in Supplementary Table 3. Patients were categorized into the two groups using cut-off values from previous studies (Table 3).
Table 3: List of candidate markers aberrantly expressed in gastric cancer
Symbol |
Name |
Location |
Function |
Status in GC* |
Cutoff* |
|---|---|---|---|---|---|
ANOS1 |
anosmin-1 |
Xp22.31 |
Neural cell adhesion and axonal migration |
Upregulated |
C median |
PRMT5 |
protein arginine methyltransferase 5 |
14q11.2 |
Transcriptional regulation, and the assembly of small nuclear ribonucleoproteins |
Upregulated |
C median |
NRAGE |
neurotrophin receptor-interacting melanoma antigen-encoding protein |
Xp11.22 |
Pro-apoptotic factor required for the normal developmental apoptosis |
Upregulated |
C mean |
MAGED2 |
MAGE family member D2 |
Xp11.21 |
Tumor specific antigens |
Upregulated |
C/N >1 |
DPYSL3 |
dihydropyrimidinase like 3 |
5q32 |
Cell-adhesion factor |
Upregulated |
C median |
SYT8 |
synaptotagmin VIII |
11p15.5 |
Membrane trafficking protein |
Upregulated |
C 0.005 |
TUSC1 |
tumor suppressor candidate 1 |
9p21.2 |
Unknown |
Downregulated |
C 1st quartile |
PDSS2 |
decaprenyl diphosphate synthase subunit 2 |
6q21 |
Synthesis of coenzyme Q10 |
Downregulated |
C/N <0.5 |
DENND2D |
DENN domain containing 2D |
1p13.3 |
Membrane trafficking protein regulating Rab GTPases |
Downregulated |
C/N <0.5 |
MZB1 |
marginal zone B and B1 cell-specific protein |
5q31.2 |
B cell activation |
Downregulated |
C median |
MFSD4 |
major facilitator superfamily domain containing 4 |
1q32.1 |
Membrane transporter |
Downregulated |
C = 0.006 |
SAMSN1 |
SAM domain, SH3 domain and nuclear localization signals 1 |
21q11.2 |
Cytoplasmic adaptor protein |
Downregulated |
C median |
BTG1 |
BTG anti-proliferation factor 1 |
12q21.33 |
Regulates cell growth and differentiation |
Downregulated |
C/N < 1/3 |
FAM46C |
family with sequence similarity 46, member C |
1p12 |
Transcription factor |
Downregulated |
C median |
GPR155 |
G protein-coupled receptor 155 |
2q31.1 |
Mediator of the visual sensing, immune function, and cell proliferation |
Downregulated |
C 0.0009 |
*From references 22, 24, 27, 29 and 32-42. C, expression levels in cancerous tissue; N, expression levels in adjacent non-cancerous tissue.
Development and validation of the integrated multigene expression panel
To build an integrated multigene expression panel, the following processes were carried out in the learning cohort. The study flowchart is shown in Figure 1A. First, C-index values of all single and combinations of the 15 candidate markers for overall survival were calculated. Second, the best C-index values for each number of combinations (1–15) were calculated. The larger the number of markers included in the panel, the greater the number of subpopulations that patients were clustered into with a corresponding decrease in the minimal number of patients in a subpopulation. Thus, third, we used the subpopulation index, calculated as number of constituents × the minimal patient number in a subpopulation, for each number of combinations to determine the most well-balanced number of markers to be included in the expression panel [19]. Fourth, the expression index was determined with weighting according to the coefficient in a Cox regression of each constituent. Fifth, provisional cutoff for the scoring (score 1 to 3) were determined in the discovery set based on the following concept. The lower cutoff line was set strictly to achieve careful selection of patients with excellent postoperative outcomes, even if the population becomes small. Similarly, the upper cutoff line was set to select patients at very high risk. Sixth, patients were classified as having expression scores of 1, 2, and 3 according to the cutoff lines of expression index. Last, the reproducibility of the integrated multigene expression panel was evaluated in the validation cohort.
Statistical analysis
The qualitative χ2 and quantitative Mann-Whitney tests were used to compare the two groups. Survival rates were calculated using the Kaplan-Meier method, and the difference between curves was analyzed using the log-rank test. The Cox regression model was used to evaluate the overall survival hazard ratio associated with each variable. The prediction score was internally validated using the C-index. The C-index is a probability of concordance between predicted and observed survival, with C = 0.5 for random predictions and C = 1 for a perfectly discriminating score. The C-index was evaluated on the discovery set using bootstrapping with 10,000 resamples [43]. Statistical analysis was performed using JMP 10 software and SAS9.4 (SAS Institute Inc., Cary, NC, USA). P <0.05 indicates a statistically significant difference.
Author contributions
MK, KM: acquisition of data, analysis and interpretation of data, drafting of the manuscript. HT, TM, SU, MH, NH: acquisition and interpretation of data, manuscript revision. CT, DK, MS, SY, GN, MF: material support, generation of data. YK: study concept and design, study supervision, interpretation of data, revision of the manuscript. MK had full access to all of the data and takes full responsibility for the veracity of the data and statistical analysis.
CONFLICTS OF INTEREST
The authors declare no conflicts of interest.
REFERENCES
1. Shen L, Shan YS, Hu HM, Price TJ, Sirohi B, Yeh KH, Yang YH, Sano T, Yang HK, Zhang X, Park SR, Fujii M, Kang YK, Chen LT. Management of gastric cancer in Asia: resource-stratified guidelines. Lancet Oncol. 2013; 14: e535-547.
2. Kanda M, Tanaka C, Kobayashi D, Mizuno A, Tanaka Y, Takami H, Iwata N, Hayashi M, Niwa Y, Yamada S, Fujii T, Sugimoto H, Murotani K, et al. Proposal of the Coagulation Score as a Predictor for Short-Term and Long-Term Outcomes of Patients with Resectable Gastric Cancer. Ann Surg Oncol. 2017; 24: 502-509.
3. Van Cutsem E, Sagaert X, Topal B, Haustermans K, Prenen H. Gastric cancer. Lancet. 2016; 388: 2654-2664.
4. Okines A, Verheij M, Allum W, Cunningham D, Cervantes A. Gastric cancer: ESMO Clinical Practice Guidelines for diagnosis, treatment and follow-up. Ann Oncol. 2010; 21: 50-54.
5. Songun I, Putter H, Kranenbarg EM, Sasako M, van de Velde CJ. Surgical treatment of gastric cancer: 15-year follow-up results of the randomised nationwide Dutch D1D2 trial. Lancet Oncol. 2010; 11: 439-449.
6. Uda H, Kanda M, Tanaka C, Kobayashi D, Inaoka K, Tanaka Y, Hayashi M, Iwata N, Yamada S, Fujii T, Sugimoto H, Murotani K, Fujiwara M, Kodera Y. Perioperative Serum Carcinoembryonic Antigen Levels Predict Recurrence and Survival of Patients with Pathological T2-4 Gastric Cancer Treated with Curative Gastrectomy. Dig Surg. 2018; 35: 55-63.
7. Nam DH, Lee YK, Park JC, Lee H, Shin SK, Lee SK, Lee YC, Cheong JH, Hyung WJ, Noh SH, Kim CB. Prognostic value of early postoperative tumor marker response in gastric cancer. Ann Surg Oncol. 2013; 20: 3905-3911.
8. Wang W, Chen XL, Zhao SY, Xu YH, Zhang WH, Liu K, Chen XZ, Yang K, Zhang B, Chen ZX, Chen JP, Zhou ZG, Hu JK. Prognostic significance of preoperative serum CA125, CA19-9 and CEA in gastric carcinoma. Oncotarget. 2016; 7: 35423-35436. https://doi.org/10.18632/oncotarget.8770.
9. Duraes C, Almeida GM, Seruca R, Oliveira C, Carneiro F. Biomarkers for gastric cancer: prognostic, predictive or targets of therapy? Virchows Arch. 2014; 464: 367-378.
10. Kanda M, Kodera Y. Recent advances in the molecular diagnostics of gastric cancer. World J Gastroenterol. 2015; 21: 9838-9852.
11. You YN, Rustin RB, Sullivan JD. Oncotype DX((R)) colon cancer assay for prediction of recurrence risk in patients with stage II and III colon cancer: A review of the evidence. Surg Oncol. 2015; 24: 61-66.
12. Jeong DH, Kim WR, Min BS, Kim YW, Song MK, Kim NK. Validation of a quantitative 12-multigene expression assay (Oncotype DX((R)) Colon Cancer Assay) in Korean patients with stage II colon cancer: implication of ethnic differences contributing to differences in gene expression. Onco Targets Ther. 2015; 8: 3817-3825.
13. McLean MH, El-Omar EM. Genetics of gastric cancer. Nat Rev Gastroenterol Hepatol. 2014; 11: 664-674.
14. Razzak M. Genetics: new molecular classification of gastric adenocarcinoma proposed by The Cancer Genome Atlas. Nat Rev Clin Oncol. 2014; 11: 499.
15. Wadhwa R, Song S, Lee JS, Yao Y, Wei Q, Ajani JA. Gastric cancer-molecular and clinical dimensions. Nat Rev Clin Oncol. 2013; 10: 643-655.
16. Zhu C, Ren C, Han J, Ding Y, Du J, Dai N, Dai J, Ma H, Hu Z, Shen H, Xu Y, Jin G. A five-microRNA panel in plasma was identified as potential biomarker for early detection of gastric cancer. Br J Cancer. 2014; 110: 2291-2299.
17. Lee KW, Lee SS, Hwang JE, Jang HJ, Lee HS, Oh SC, Lee SH, Sohn BH, Kim SB, Shim JJ, Jeong W, Cha M, Cheong JH, et al. Development and Validation of a Six-Gene Recurrence Risk Score Assay for Gastric Cancer. Clin Cancer Res. 2016; 22: 6228-6235.
18. Wang P, Wang Y, Hang B, Zou X, Mao JH. A novel gene expression-based prognostic scoring system to predict survival in gastric cancer. Oncotarget. 2016; 7: 55343-55351. https://doi.org/10.18632/oncotarget.10533.
19. Kanda M, Murotani K, Sugimoto H, Miwa T, Umeda S, Suenaga M, Hayashi M, Hattori N, Tanaka C, Kobayashi D, Yamada S, Fujiwara M, Kodera Y. An integrated multigene expression panel to predict long-term survival after curative hepatectomy in patients with hepatocellular carcinoma. Oncotarget. 2017; 8: 71070-71079. https://doi.org/10.18632/oncotarget.20639.
20. Harper R, Xu C, Di P, Chen Y, Privalsky M, Wu R. Identification of a novel MAGE D2 antisense RNA transcript in human tissues. Biochem Biophys Res Commun. 2004; 324: 199-204.
21. Papageorgio C, Brachmann R, Zeng J, Culverhouse R, Zhang W, McLeod H. MAGED2: a novel p53-dissociator. Int J Oncol. 2007; 31: 1205-1211.
22. Kanda M, Nomoto S, Oya H, Takami H, Shimizu D, Hibino S, Hashimoto R, Kobayashi D, Tanaka C, Yamada S, Fujii T, Nakayama G, Sugimoto H, et al. The Expression of Melanoma-Associated Antigen D2 Both in Surgically Resected and Serum Samples Serves as Clinically Relevant Biomarker of Gastric Cancer Progression. Ann Surg Oncol. 2016; 23: 214-221.
23. Xu Z, Wei G, Chepelev I, Zhao K, Felsenfeld G. Mapping of INS promoter interactions reveals its role in long-range regulation of SYT8 transcription. Nat Struct Mol Biol. 2011; 18: 372-378.
24. Kanda M, Shimizu D, Tanaka H, Tanaka C, Kobayashi D, Hayashi M, Iwata N, Niwa Y, Yamada S, Fujii T, Sugimoto H, Murotani K, Fujiwara M, Kodera Y. Significance of SYT8 For the Detection, Prediction, and Treatment of Peritoneal Metastasis From Gastric Cancer. Ann Surg. 2018; 267: 495-503.
25. Kanda M, Sugimoto H, Nomoto S, Oya H, Hibino S, Shimizu D, Takami H, Hashimoto R, Okamura Y, Yamada S, Fujii T, Nakayama G, Koike M, et al. Bcell translocation gene 1 serves as a novel prognostic indicator of hepatocellular carcinoma. Int J Oncol. 2015; 46: 641-648.
26. Buitenkamp TD, Pieters R, Zimmermann M, de Haas V, Richards SM, Vora AJ, Mitchell CD, Schwab C, Harrison CJ, Moorman AV, van den Heuvel-Eibrink MM, Zwaan CM. BTG1 deletions do not predict outcome in Down syndrome acute lymphoblastic leukemia. Leukemia. 2013; 27: 251-252.
27. Kanda M, Oya H, Nomoto S, Takami H, Shimizu D, Hashimoto R, Sueoka S, Kobayashi D, Tanaka C, Yamada S, Fujii T, Nakayama G, Sugimoto H, et al. Diversity of clinical implication of B-cell translocation gene 1 expression by histopathologic and anatomic subtypes of gastric cancer. Dig Dis Sci. 2015; 60: 1256-1264.
28. Barbieri M, Manzoni M, Fabris S, Ciceri G, Todoerti K, Simeon V, Musto P, Cortelezzi A, Baldini L, Neri A, Lionetti M. Compendium of FAM46C gene mutations in plasma cell dyscrasias. Br J Haematol. 2016; 174: 642-645.
29. Tanaka H, Kanda M, Shimizu D, Tanaka C, Kobayashi D, Hayashi M, Iwata N, Yamada S, Fujii T, Nakayama G, Sugimoto H, Fujiwara M, Niwa Y, Kodera Y. FAM46C Serves as a Predictor of Hepatic Recurrence in Patients with Resectable Gastric Cancer. Ann Surg Oncol. 2017; 24: 3438-3445.
30. Japanese Gastric Cancer Association. Japanese gastric cancer treatment guidelines 2014 (ver. 4). Gastric Cancer. 2017; 20: 1-19.
31. Kanda M, Kodera Y, Sakamoto J. Updated evidence on adjuvant treatments for gastric cancer. Expert Rev Gastroenterol Hepatol. 2015; 9:1549-1560.
32. Kanda M, Nomoto S, Oya H, Hashimoto R, Takami H, Shimizu D, Sonohara F, Kobayashi D, Tanaka C, Yamada S, Fujii T, Nakayama G, Sugimoto H, et al. Decreased expression of prenyl diphosphate synthase subunit 2 correlates with reduced survival of patients with gastric cancer. J Exp Clin Cancer Res. 2014; 33: 88.
33. Kanda M, Nomoto S, Oya H, Shimizu D, Takami H, Hibino S, Hashimoto R, Kobayashi D, Tanaka C, Yamada S, Fujii T, Nakayama G, Sugimoto H, et al. Dihydropyrimidinase-like 3 facilitates malignant behavior of gastric cancer. J Exp Clin Cancer Res. 2014; 33: 66.
34. Kanda M, Shimizu D, Nomoto S, Hibino S, Oya H, Takami H, Kobayashi D, Yamada S, Inokawa Y, Tanaka C, Fujii T, Sugimoto H, Koike M, et al. Clinical significance of expression and epigenetic profiling of TUSC1 in gastric cancer. J Surg Oncol. 2014; 110: 136-144.
35. Kanda M, Shimizu D, Nomoto S, Takami H, Hibino S, Oya H, Hashimoto R, Suenaga M, Inokawa Y, Kobayashi D, Tanaka C, Yamada S, Fujii T, et al. Prognostic impact of expression and methylation status of DENN/MADD domain-containing protein 2D in gastric cancer. Gastric Cancer. 2015; 18: 288-296.
36. Kanda M, Shimizu D, Fujii T, Sueoka S, Tanaka Y, Ezaka K, Takami H, Tanaka H, Hashimoto R, Iwata N, Kobayashi D, Tanaka C, Yamada S, et al. Function and diagnostic value of Anosmin-1 in gastric cancer progression. Int J Cancer. 2016; 138: 721-730.
37. Kanda M, Shimizu D, Fujii T, Tanaka H, Shibata M, Iwata N, Hayashi M, Kobayashi D, Tanaka C, Yamada S, Nakayama G, Sugimoto H, Koike M, et al. Protein arginine methyltransferase 5 is associated with malignant phenotype and peritoneal metastasis in gastric cancer. Int J Oncol. 2016; 49: 1195-1202.
38. Kanda M, Shimizu D, Fujii T, Tanaka H, Tanaka Y, Ezaka K, Shibata M, Takami H, Hashimoto R, Sueoka S, Iwata N, Kobayashi D, Tanaka C, et al. Neurotrophin Receptor-Interacting Melanoma Antigen-Encoding Gene Homolog is Associated with Malignant Phenotype of Gastric Cancer. Ann Surg Oncol. 2016; 23: 532-539.
39. Kanda M, Shimizu D, Sueoka S, Nomoto S, Oya H, Takami H, Ezaka K, Hashimoto R, Tanaka Y, Kobayashi D, Tanaka C, Yamada S, Fujii T, et al. Prognostic relevance of SAMSN1 expression in gastric cancer. Oncol Lett. 2016; 12: 4708-4716.
40. Kanda M, Shimizu D, Tanaka H, Shibata M, Iwata N, Hayashi M, Kobayashi D, Tanaka C, Yamada S, Fujii T, Nakayama G, Sugimoto H, Koike M, et al. Metastatic pathway-specific transcriptome analysis identifies MFSD4 as a putative tumor suppressor and biomarker for hepatic metastasis in patients with gastric cancer. Oncotarget. 2016; 7: 13667-13679. https://doi.org/10.18632/oncotarget.7269.
41. Kanda M, Tanaka C, Kobayashi D, Tanaka H, Shimizu D, Shibata M, Takami H, Hayashi M, Iwata N, Niwa Y, Yamada S, Fujii T, Nakayama G, et al. Epigenetic suppression of the immunoregulator MZB1 is associated with the malignant phenotype of gastric cancer. Int J Cancer. 2016; 139: 2290-2298.
42. Shimizu D, Kanda M, Tanaka H, Kobayashi D, Tanaka C, Hayashi M, Iwata N, Niwa Y, Takami H, Yamada S, Fujii T, Nakayama G, Fujiwara M, Kodera Y. GPR155 Serves as a Predictive Biomarker for Hematogenous Metastasis in Patients with Gastric Cancer. Sci Rep. 2017; 7: 42089.
43. Harrell F. Regression Modeling Strategies: With Applications to Linear Models, Logistic Regression, and Survival Analysis. New York: Springer-Verlag; 2001.