INTRODUCTION
Pulmonary sarcomatoid carcinomas are rare tumors, representing only 0.3–1.3% of non-small cell lung cancer cases [1]. These carcinomas are defined as a small subgroup of poorly differentiated tumors containing sarcoma-like elements. They are characterized by poor prognosis and resistance to conventional platinum-based chemotherapy and radiotherapy [2, 3]. Furthermore, the prognosis is often poor, irrespective of the stage of disease [2, 3]. Little is known about the biology of these neoplasms or the mechanisms of chemo- or radio-resistance and progression.
Pulmonary sarcomatoid carcinomas contain a sarcoma-like element (i.e. spindle or giant cells) associated with an epithelial component (i.e. adenocarcinoma, squamous cell carcinoma or poorly differentiated large-cell carcinoma) [1]. However, they are rare and their histology is poorly defined, so certain hypotheses regarding the development of sarcomatoid carcinoma, such as the collision of two independent cancers, or the transformation from carcinomatous to sarcomatous components and vice-versa, have been proposed [4–7]. The low frequency and histological heterogeneity of these tumors could account for the lack of studies on their carcinogenic mechanisms.
In this study, the epithelial and sarcomatous components in pulmonary sarcomatoid carcinoma were accurately separated by laser capture microdissection, and the mutation profiles were compared to determine whether the clonal origin of the components was identical. In addition, by utilizing in silico analysis, the evolutionary development of sarcomatoid cancer was estimated in order to identify the driver mutation suitable for treatment. Because genomic profiling is becoming increasingly crucial in the management of non-small cell lung cancer, new therapeutic strategies can be proposed based on our results related to the carcinogenesis of sarcomatoid cancer. Particularly, the clinical applicability of immune checkpoint blockade therapy, which has recently attracted attention as a treatment for non-small cell lung cancer was examined based on genomic and phenotypic characteristics.
RESULTS
Patient characteristics
Four patients who underwent surgery for sarcomatoid cancer were enrolled in this study. Three of these patients underwent lobectomy with or without chest wall resection as curative surgery and one patient underwent incisional biopsy because the tumor was unresectable (Table 1). The patient age ranged from 60 to 83 years (mean ± standard deviation [SD], 77.0 ± 7.0 years). There were three male and one female patients. The Brinkmann index (mean ± SD) was 1900 ± 818, and all four patients were smokers (Table 1).
Table 1: Patient characteristics
Age |
Sex |
Smoking |
B.I. |
size (mm) |
pTNM |
pStage |
Histology |
Surgery |
Outcome |
|
|---|---|---|---|---|---|---|---|---|---|---|
Case 1 |
83 |
M |
current |
2520 |
110 |
pT4N0M0 |
IIIA |
AdC+SaC |
Lobectomy+Chest wall resection |
3m, death |
Case 2 |
78 |
F |
current |
780 |
47 |
pT3N0M0 |
IIB |
AdC+SaC |
Lobectomy+Chest wall resection |
18m, no recurrence |
Case 3 |
67 |
M |
former |
1800 |
55 |
pT4N2M0 |
IIIB |
AdC+SaC |
Biopsy |
12m, stable disease |
Case 4 |
80 |
M |
former |
2500 |
25 |
pT1cN0M0 |
IA3 |
SCC+SaC |
Lobectomy |
2m, no recurrence |
B.I., Brinkman index; AdC, adenocarcinoma component; SaC, sarcomatous component; SCC, squamous cell carcinoma component; M, male; F, female; pStage, pathological stage; m, months.
Computed tomography showed that the maximum tumor diameter (mean ± SD) was 59.3 ± 36.1 mm (Table 1); most of the tumors were very large and had invaded the chest wall or mediastinum (Figure 1). On hematoxylin and eosin sections, the sarcomatous component was randomly distributed with no apparent pattern (Figure 1). Histologically, the epithelial component was adenocarcinoma in three cases and squamous cell carcinoma in one case, whereas the sarcomatous component was a mixture of spindle-shaped cells and giant cells in all cases (Figure 1). The postoperative pathological stages were IA3, IIB, IIIA and IIIB (Table 1).
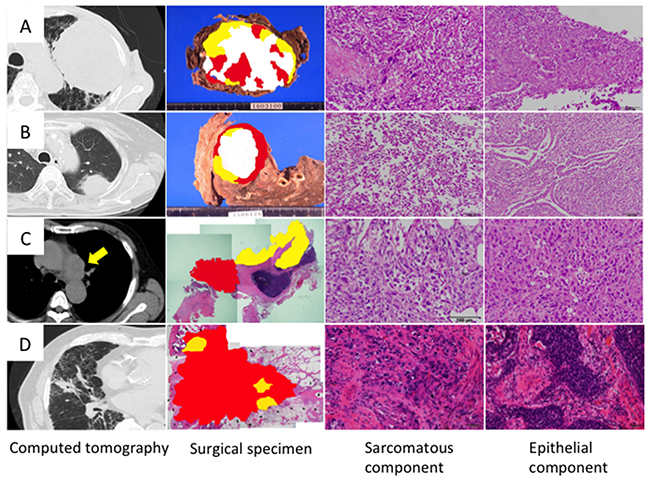
Figure 1: Histology of sarcomatoid cancer. Cases 1, 2, 3 and 4 correspond to Figures (A, B, C and D), respectively. Topographic presentation of the cut surface of the surgical specimens shows three different components; The carcinomatous and sarcomatous components are shown in yellow and red, respectively, and necrotized tissues are shown in white. Cancer cells were selected from carcinomatous and sarcomatous portions separately by laser capture microdissection.
Determination of the sarcomatoid carcinoma mutation profiles by targeted deep sequencing
Somatic mutations whose allele fractions were greater than 1% were regarded as significant and utilized for the analyses. As shown by the heat map, the carcinomatous and sarcomatous components had 1–4 common mutations (Figure 2). In contrast, the sarcomatous component had many mutations that were different from those of the carcinomatous component, and the number of mutations identified was greater in the sarcomatous component (Figure 2).
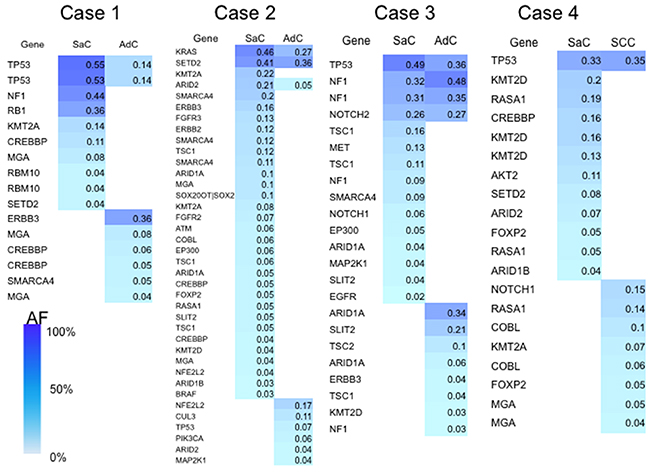
Figure 2: Heat map of the gene mutations. This map shows the gene mutations of each component of the sarcomatoid cancers. The column next to the heat map shows the mutated genes. SaC, sarcomatous component; AdC, adenocarcinoma component; SCC, squamous cell carcinoma; AF, allele fraction.
A beeswarm plot for the allele fraction of the mutations in each histological component is presented in Figure 3 for visualization purposes. Several co-mutations clearly exist at relatively higher allele fraction in each component, while many mutations with low allele fraction were exclusively present in each component.
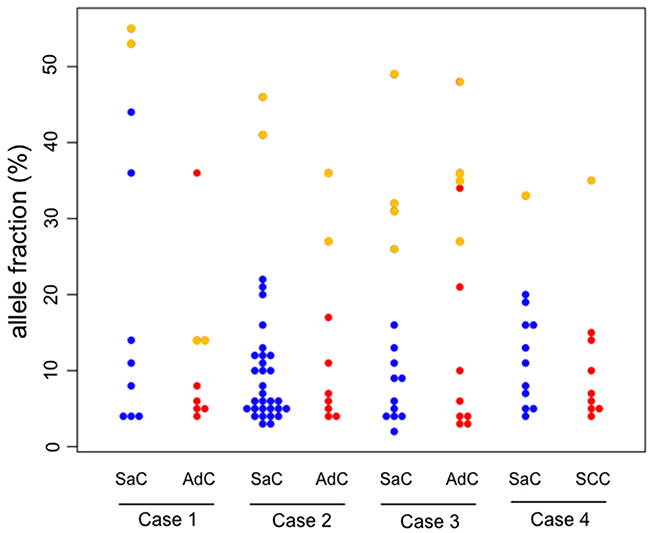
Figure 3: Beeswarm plot of the allele fraction of the gene mutations. In the beeswarm plot, each colored dot represents a somatic mutation. Blue and red dots denote mutations which are exclusively present in the sarcomatous and adenocarcinoma component, respectively. Yellow points represent co-mutations which are shared by both histological components. SaC, sarcomatous component; AdC, adenocarcinoma component; SCC, squamous cell carcinoma.
PyClone analysis of sarcomatoid cancer based on targeted deep sequencing
PyClone is a Bayesian clustering method for grouping sets of deeply sequenced somatic mutations into putative clonal clusters while estimating their cellular prevalence and accounting for the allelic imbalances introduced by segmental copy number changes and normal cell contamination. PyClone analysis was performed based on the information obtained on genetic mutations. The analysis showed that the cellular prevalence of the common mutations between the carcinomatous and sarcomatous components was relatively high in all cases (Figure 4). It was inferred that the relatively major cell population in each component harbored several co-mutations. In contrast, in an additional experiment, samples were obtained from two different sites in the same tumor in two cases of adenocarcinoma as well as two cases of squamous cell carcinoma, and PyClone analysis was performed (Supplementary Figure 1). Each cancer sample harbored relatively few mutations, ranging from 2–7 (mean 3.9 ± 1.8), and mutations common to both sites were predominant (Supplementary Figure 1). In addition, in each of these tumors, homologous mutations were highly prevalent in two sites of the same tumor (Supplementary Figure 1). Thus, in these cancers displaying conventional histology, tumor cells had a relatively uniform mutation profile compared to the one observed in sarcomatoid cancers.
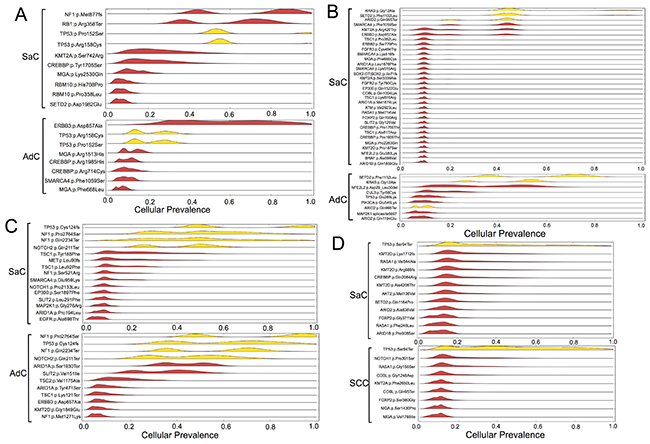
Figure 4: Statistical inference of the clonal population structure. Case 1, 2, 3 and 4 corresponds to Figure (A, B, C and D), respectively. The estimated cellular frequencies of the samples are shown as the distribution of posterior probabilities from the PyClone model. The red part represents the distribution of mutations harbored exclusively by each histological component. The yellow part represents the distribution of co-mutations shared by both components. SaC, sarcomatous component; AdC, adenocarcinoma component; SCC, squamous cell carcinoma.
Phylogenetic analysis of sarcomatoid cancer based on targeted deep sequencing
For further inference of the phylogenies and estimation of the evolutionary distances, the neighbor-joining method was implemented to cluster the nonsilent mutations, and a phylogenetic tree was constructed (Figure 5). In all cases, the phylogenetic trees had similar topologies. Specifically, the trees had short trunks representing 2–4 common mutations, suggesting evolution from a common origin. Moreover, the branch representing the lineage to the sarcomatous component was longer than the one to the epithelial component. This finding reflects the fact that many mutations different from those in the epithelial component accumulated in the sarcomatous component.
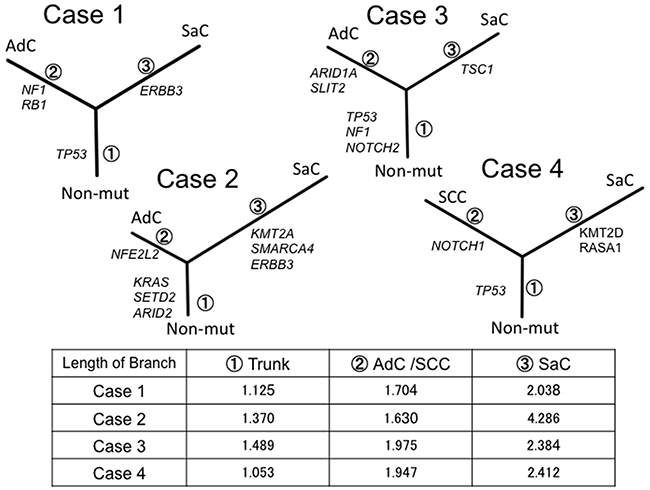
Figure 5: Phylogenetic analysis based on the targeted sequencing. The phylogenetic tree was constructed using the bootstrap method. Potential mutations were acquired by the indicated genes in the branch. Branch length indicates the evolutionary distance and is correlated with the number of nucleotide substitutions. SaC, sarcomatoous component; AdC, adenocarcinoma component; SCC, squamous cell carcinoma; Non-mut, non-mutated cells.
Phylogenetic analysis of sarcomatoid cancer based on whole exome sequencing
In order to better characterize the biology of sarcomatoid carcinoma, we performed whole exome sequencing in cases 1, 2 and 4. This analysis was not performed in case 3 because of the insufficient amount of input DNA. Phylogenetic trees similar to those based on targeted deep sequencing were created for cases 1, 2 and 4. The sarcomatous component accumulated a large number of unique mutations, indicating that this component was substantially different from the epithelial component in terms of genetic status (Figure 6).
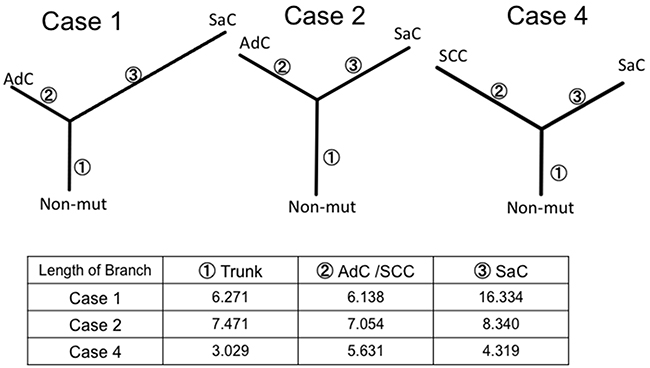
Figure 6: Phylogenetic analysis based on whole exome sequencing. The phylogenetic tree was constructed using the bootstrap method. Branch length indicates the evolutionary distance and is proportional to the number of nonsynonymous mutations. SaC, sarcomatous component; AdC, adenocarcinoma component; SCC, squamous cell carcinoma; Non-mut, non-mutated cells.
Genomic and immunohistochemical evaluation of microsatellite instability
Whole exome sequencing revealed somatic mutations in the MutL homolog 1 (MLH1) gene in Case 1 (Table 2, Supplementary Table 1). This MLH1K311fs mutation was a frame-shift mutation, leading to loss of mismatch repair function. Both the carcinomatous and sarcomatous components harbored this somatic mutation (Supplementary Table 1). Microsatellite instability (MSI) analysis revealed that the cancers in Cases 2-4 exhibited microsatellite stability, whereas two and three markers were positive for adenocarcinoma and sarcomatous components in Case 1, respectively (Figure 7A, Table 3). Thus, both the adenocarcinomatous and sarcomatous components in Case 1 displayed a high level of MSI. Immunohistochemically, MLH1, MutS protein homolog (MSH) 2, MSH6 and Postmeiotic segregation increased 2 (PMS2) were all expressed in the nuclei of tumor cells in Cases 2 and 3, whereas MLH1 and PMS2 were not expressed in Case 1, suggesting the mismatch repair function had diminished in Case 1 (Figure 7B, Table 3). There was no significant difference in the staining intensity between the sarcomatous and adenocarcinoma components (data not shown). Altogether, whole exome sequencing, MSI analysis and immunohistochemical staining consistently supported microsatellite instability in Case 1 (Table 3).
Table 2: Mutation burden and MMR genes mutation detected by next generation sequencing
Mutation burden |
Mutation burden |
Mutation of MMR genes |
|
|---|---|---|---|
<panel> |
<wes> |
||
(EpC/SaC/total) |
(EpC/SaC/total) |
||
Case 1 |
8/10/16 |
154/511/665 |
MLH-1 |
Case 2 |
9/32/39 |
221/395/616 |
None |
Case 3 |
12/15/23 |
- |
- |
Case 4 |
8/12/19 |
85/72/117 |
None |
WES, whole exome sequence; EpC, epithelial component; SaC, sarcomatous component; MMR, mismatch repair; -, not examined.
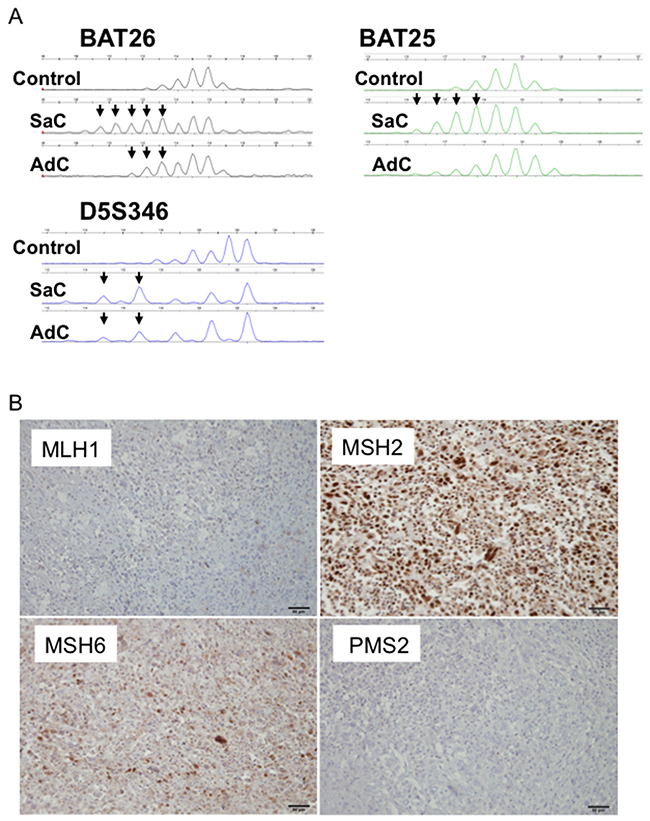
Figure 7: MSI profiles in Case 1. (A) Size variation in the number of microsatellite repeats for BAT25, BAT26 and D5S346 in Case 1. A peripheral blood sample was used as a control. SaC, sarcomatous component; AdC, adenocarcinoma component. (B) Mismatch repair protein expression in Case 1. MLH1 and PMS2 were not expressed.
Table 3: Evaluation of microsatellite instability status
Sample |
BAT25 |
BAT26 |
D17S250 |
D2S123 |
D5S346 |
Number of markers |
MSI status |
MMR genes mutations |
MLH1 IHC |
MSH2 IHC |
MSH6 IHC |
PMS2 IHC |
|---|---|---|---|---|---|---|---|---|---|---|---|---|
Case 1 AdC |
- |
+ |
- |
- |
+ |
2 |
MSI-High |
MLH1 Somatic Mutation |
Negative |
Positive |
Positive |
Negative |
Case 1 SaC |
+ |
+ |
- |
- |
+ |
3 |
MSI-High |
MLH1 Somatic Mutation |
Negative |
Positive |
Positive |
Negative |
Case 2 AdC |
- |
- |
- |
- |
- |
- |
MSS |
None |
Positive |
Positive |
Positive |
Positive |
Case 2 SaC |
- |
- |
- |
- |
- |
- |
MSS |
None |
Positive |
Positive |
Positive |
Positive |
Case 3 AdC |
- |
- |
- |
- |
- |
- |
MSS |
ND |
Positive |
Positive |
Positive |
Positive |
Case 3 SaC |
- |
- |
- |
- |
- |
- |
MSS |
ND |
Positive |
Positive |
Positive |
Positive |
Case 4 SCC |
- |
- |
- |
- |
- |
- |
MSS |
None |
Positive |
Positive |
Positive |
Positive |
Case 4 SaC |
- |
- |
- |
- |
- |
- |
MSS |
None |
Positive |
Positive |
Positive |
Positive |
Pathogenetic findings are highlighted in red.
AdC, adenocarcinoma component; SaC, sarcomatous component; SCC, squamous cell carcinoma; MSI, microsatellite instability; MSS, microsatellite stable; MMR, mismatch repair; IHC, immunohistochemistry; ND, not determined.
Immunohistochemical staining of programmed death ligand-1 (PD-L1)
In all four patients, PD-L1 expression was observed on the membrane of tumor cells in both the epithelial and sarcomatous components (Figure 8A). The staining intensity of PD-L1 expression was 85.0 ± 23.8 % and 55.0 ± 42.0 % in the sarcomatous and epithelial components, respectively (Figure 8A). PD-L1 expression did not significantly differ between the two components (p = 0.26). There was no significant correlation between PD-L1 staining and mutation burden (p = 0.49).
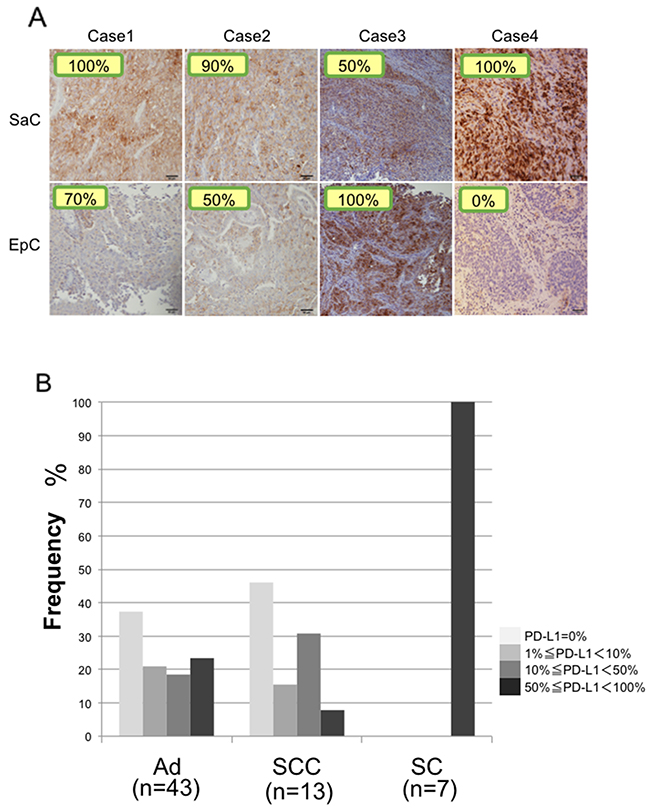
Figure 8: Immunohistochemical staining of PD-L1. (A) PD-L1 expression in the sarcomatous and epithelial components in all cases. The staining level is quantitatively shown in the image. SaC, sarcomatous component; EpC, epithelial component. (B) Proportions of patients with PD-L1 expression in adenocarcinoma, squamous cell carcinoma and sarcomatoid carcinoma. Ad, adenocarcinoma; SCC, squamous cell carcinoma; SC, sarcomatoid cancer.
DISCUSSION
Pulmonary sarcomatoid carcinoma is a small subgroup of poorly differentiated tumors containing sarcoma-like elements; however, the carcinogenesis of these tumors remains unclear. Pulmonary sarcomatoid carcinomas may undergo a dedifferentiation process with activation of an epithelial-mesenchymal transition [4]. These phenotypic changes to sarcomatoid cancer are thought to be associated with the addition of unique mutation patterns [6]. In this study, we were able to analyze the mutations of the two components in pulmonary sarcomatoid carcinoma separately and comprehensively utilizing bioinformatics in combination with laser capture microdissection, next generation sequencing and in silico analysis. This enabled investigation of the carcinogenic process underlying pulmonary sarcomatoid carcinoma from the perspective of genome evolution. The results supported the hypothesis that the components have a common origin [5–7]. In addition, comparison of the mutation profile in each component showed that the genomic distance between carcinomatous and sarcomatous components increased following the accumulation of additional mutations. Furthermore, the sarcomatous component showed a greater accumulation of mutations and a larger genetic distance to the common-origin than the epithelial component. These genetic characteristics may explain why sarcomatoid carcinoma is high-grade and resistant to conventional chemotherapy.
The neighbor-joining method was applied to analyze complex models of nucleotide substitutions for the purpose of estimating evolutionary distance and to infer the phylogeny of the sarcomatoid cancer [8]. Neighbor-joining is one of the most popular distance-based reconstruction techniques and is an agglomerative clustering approach in which at each stage two neighboring elements are joined to one cluster; this new cluster then replaces them in the set of elements, and the clustering continues recursively on this reduced set [8]. Thus, we established sarcomatoid cancer phylogenetic trees that exhibited a similar structure, regardless of whether panel sequencing or whole exome sequencing was performed. In addition, in silico analysis led to the following reasoning regarding treatment. First, trunk mutations are thought to be present in many cell populations in both components and function as putative driver mutations; therefore, molecular targeted therapy against trunk mutations would be expected to be effective. Second, considering the many mutations in the branches of the phylogenetic trees, treatment with anti-PD-1/PD-L1 therapies would also be expected to be effective [9].
An analysis was performed on patients who had undergone targeted deep sequencing in our department, including those with adenocarcinoma, squamous cell carcinoma and sarcomatoid cancer; the numbers of mutations with an allele frequency of greater than 1% were compared among these three groups. The mutation burden in sarcomatoid carcinoma was significantly higher than that in adenocarcinoma and squamous cell carcinoma (Supplementary Figure 2). In several cohort studies, higher nonsynonymous mutation burden in tumors was associated with improved objective response, durable clinical benefit and progression-free survival in anti-PD-1/PD-L1 therapies [10]. Tumors with a high number of mutation-associated neoantigens may be more likely to stimulate the immune system to react against the tumor mutation burden. In some cases, patients with renal cell carcinoma with sarcomatoid features were found to respond to anti-PD-1 therapy [11, 12].
Mismatch repair (MMR) is an important type of DNA repair and plays a pivotal role in maintaining genome stability [13]. The MMR genes (MLH1, MSH2, MSH6 and PMS2), which are key components of the MMR system, recognize and excise single-base mismatches and insertion/deletion loops that occur during DNA replication or DNA damage [14]. MMR dysfunction often leads to genomic instability, including microsatellite instability and the accumulation of gene mutations that are thought to be associated with various malignant tumors [15, 16].
MMR-deficient colorectal cancers have 10–100 times as many somatic mutations as MMR-proficient colorectal cancers [17, 18]. MMR-deficient colorectal cancers exhibit different clinical behavior from those of MMR-proficient cancers, and MMR status predicts the clinical benefit of an anti-PD-1 immune checkpoint inhibitor [10]. MMR deficiency occurs in several types of cancers, including those of the colorectum, uterus, stomach, biliary tract, pancreas, ovary, prostate and small intestine [18–26]. However, it is not clear whether MMR affects the gene mutations in non-small cell lung cancer. Data on the prevalence of microsatellite instability among non-small cell lung cancers are conflicting, with estimates ranging between 0% and 0.8% [27, 28], and the clinical relevance of microsatellite instability is largely unknown.
Hereditary nonpolyposis colorectal cancer (also known as Lynch syndrome) results from an inherited germline defect in one of four MMR genes (MLH1, MSH2, MSH6 and PMS2) followed by a second inactivating somatic change in the remaining wild-type allele. However, our case (Case 1) was thought to be a sporadic MMR-deficient tumor in which both alleles of the MLH1 gene were inactivated by somatic mutation.
Pulmonary sarcomatoid cancers are associated with poor prognosis and high levels of chemoresistance, highlighting the necessity for the identification of potential new therapies. New targets must therefore be explored in order to improve the management of these tumors. Therapies targeting immune molecule checkpoints could be particularly interesting in this regard. PD-1 is a co-inhibitory inducible receptor present on T cells and macrophages [29]. Tumor cells with increased PD-L1 expression are believed to escape immunity through activation of the PD-1/PD-L1 pathway and suppression of the effector-immune responses [29]. Recent strategies targeting the PD-1/PD-L1 axis have shown promising results in patients with several tumors types, including lung carcinomas [30–32]. Recent randomized controlled trials have suggested that PD-L1 protein expression may have a predictive response to such therapies [33]. Comparisons of PD-L1 staining were performed in patients who underwent PD-L1 staining in our department, including patients with adenocarcinoma, squamous cell carcinoma and sarcomatoid cancer. PD-L1 staining was also performed in three surgical cases of sarcomatoid cancer treated in 2007–2013, so the total number of cases of sarcomatoid cancer examined by PD-L1 staining was seven. The results showed that PD-L1 was expressed in 50% or more of cancer cells in all patients with sarcomatoid cancer, and the proportion of patients with strong staining was significantly greater in sarcomatoid cancer than in adenocarcinoma and squamous cell carcinoma (Figure 8B). Our findings support the potential value of anti-PD-1/PD-L1 targeted therapies.
This study has a few limitations. The sample sizes were extremely small due to the rare occurrence of sarcomatoid cancer. Therefore, further studies are warranted to confirm our results. Nevertheless, our findings clearly supported the possibility of using novel immunotherapy approaches, such as PD-1/PD-L1 blockers, in this otherwise difficult-to-treat disease. We anticipate that the use of PD-L1 or PD-1 immunotherapy in this histological subtype will be validated by prospective and comparative studies in the future.
MATERIALS AND METHODS
Patients and sample preparation
Four patients who had undergone surgery in our department for pulmonary sarcomatoid cancers between July 2014 and March 2016 were enrolled in this study. All participants provided written informed consent prior to participation in the genetic research. The research was conducted in accordance with the Declaration of Helsinki, and the study was approved by the Institutional Review Board Committee of Yamanashi Central Hospital (Yamanashi, Japan).
Serial sections of formalin-fixed, paraffin-embedded (FFPE) tissues were stained with hematoxylin-eosin. To examine whether different histological components resulted from genetic divergence, tumor cells of the epithelial and sarcomatous areas were collected from FFPE tissues using an ArcturusXT laser-capture microdissection system (Thermo Fisher Scientific Waltham, MA).
DNA was extracted using a QIAamp DNA FFPE Tissue Kit (Qiagen, Hilden, Germany). FFPE DNA quality was checked using primers for the ribonuclease P (RNase P) locus [34]. A peripheral blood sample was collected from each patient just prior to surgery. The buffy coat was isolated following centrifugation, and DNA was extracted from the buffy coat using a QIAamp DNA Blood Mini Kit with a QIAcube system (Qiagen).
Targeted deep sequencing and data analysis
A panel targeting the exons of 53 lung cancer-associated genes (Supplementary Table 2) was established to perform targeted sequencing. We searched the literature and selected these genes based on the following criteria: (a) genes often involved in lung cancer from The Cancer Genome Atlas [35, 36] and other projects [37–41] or (b) genes frequently mutated in lung cancer from the COSMIC database (http://cancer.sanger.ac.uk/cancergenome/projects/cosmic). Primer design for the targeted sequencing was performed using Ion AmpliSeq designer software (Thermo Fisher Scientific), as previously reported [42–44]. Sequencing libraries were prepared using an Ion AmpliSeq Library kit (Thermo Fisher Scientific) according to the manufacturer’s instructions. After barcode ligation using an Ion Xpress Barcode Adapters kit (Thermo Fisher Scientific), library samples were purified using Agencourt AMPure XP reagent (Beckman Coulter, Brea, CA) and subsequently quantified using an Ion Library Quantitation Kit (Thermo Fisher Scientific). Emulsion PCR and chip loading were performed on the Ion Chef with the Ion PI Hi-Q Chef kit. Sequencing was performed using an Ion PI Hi-Q Sequencing Kit on the Ion Proton Sequencer (Thermo Fisher Scientific).
The sequence data were processed using standard Ion Torrent Suite Software running on the Torrent Server. Raw signal data were analyzed using Torrent Suite version 5.0.4. The pipeline included signaling processing, base calling, quality score assignment, read alignment to the human genome 19 reference (hg19), quality control of mapping and coverage analysis. Following data analysis, annotation of single nucleotide variants, insertions and deletions was performed using an Ion Reporter Server System (Thermo Fisher Scientific), and lymphocytes from peripheral blood DNA were used as a control to detect variants (Tumor-Normal pair analysis) [45]. Sequence data were visually confirmed with the Integrative Genomics Viewer. Beeswarm plots were produced using R package graphics and Beeswarm.
Whole exome sequencing
Whole exome sequencing and multiplex PCR were performed using buffy coat DNA and tumor DNA with an Ion AmpliSeq Exome RDY Kit (Thermo Fisher Scientific). The pooled PCR amplicons were treated with FuPa reagent to partially digest the primer sequences and phosphorylate the amplicons. The amplicons were ligated to adapters with the diluted barcodes of the Ion Xpress Barcode Adapters kit (Thermo Fisher Scientific).
Adaptor-ligated amplicon libraries were purified using Agencourt AMPure XP reagents (Beckman Coulter). Each library was diluted and the same amount of each library was pooled for a single sequence reaction. Emulsion PCR and chip loading was performed on the Ion Chef with the Ion PI Hi-Q Chef kit. Sequencing was performed using an Ion PI Hi-Q Sequencing Kit on the Ion Proton Sequencer (Thermo Fisher Scientific).
In silico analysis
For further inference of the phylogenies and estimation of the evolutionary distances, the neighbor-joining method was implemented to cluster the nonsilent mutations, and a phylogenetic tree was constructed [46]. The ‘ape’ and ‘phangon R’ (3.2.3 on linux) packages were utilized for these analyses.
To estimate the fraction of cancer cells harboring a mutation, PyClone analysis was performed [47]. Mutations whose allele fractions were greater than 1% were regarded as significant and were utilized for in silico analyses.
Microsatellite instability analysis
For MSI analysis, five microsatellite markers (BAT25, BAT26, D5S346, D2S123 and D17S250) were used to classify the tumor as MSI-high (the presence of at least two markers showing novel alleles compared with normal control), MSI-low (defined as one marker with a novel allele), or microsatellite stable (MSS, no marker with novel alleles) [48]. Electrophoretic mobility in these microsatellites from tumors and matched peripheral blood samples was compared. Fluorescently labeled PCR products were separated by capillary electrophoresis using a 3500 Genetic Analyzer (Applied Biosystems) and the product size was analyzed with GeneMapper Software 5 (Applied Biosystems). The primer sequences are provided in Supplementary Table 3 [49].
Immunohistochemistry for MMR disturbance and immune-checkpoint PD-L1
FFPE tissue sections were cut in 5-μm-thick slices, deparaffinized and rehydrated. All slides were sectioned within 2 months of staining. Immunohistochemistry analysis was performed on tumor samples using commercially available detection kits, automated staining techniques (Ventana Benchmark ULTRA system; Roche, Tucson, AZ), and antibodies against MLH1 (M1; Ventana), MSH2 (G219-1129; Ventana), MSH6 (44; Ventana), PMS2 (EPR3947; Ventana) and PD-L1 [8–28] (ab205921;Abcam, at 1/250 dilution). Microsatellite instability was assessed using immunostaining patterns for the four genes involved in MMR (MLH1, MSH2, MSH6 and PMS2). In the normal state, the four proteins are supposed to be diffusely expressed; however, in the presence of abnormalities, the expression of these proteins is abolished. Immunohistochemistry is reported to provide a rapid, cost-effective, sensitive (92.3%) and extremely specific (100%) method for the screening of DNA mismatch repair defects [50]. Samples were dichotomized as having positive or negative staining for each MMR protein. For PD-L1, the expression was evaluated on a quantitative scale, from 0% to 100%, by two pathologists.
Statistical analysis
Continuous variables are presented as means ± SDs and compared using the unpaired Student’s t-test. One-way analysis of variance and Tukey-Krammer multiple comparisons tests were used to detect significant differences between groups. Chi-square tests were used to compare the categorical data between groups. Correlations between samples were calculated using Pearson’s correlation coefficient. All statistical analyses were performed using the JMP function in the SAS software package (SAS Institute, Inc., Cary, NC, USA). P values of less than 0.05 in two-tailed analyses were considered to denote statistical significance.
Abbreviations
MMR, mismatch repair; MSI, microsatellite instability; MLH1, MutL homolog 1; MSH2, MutS protein homolog 2; MSH6, MutS protein homolog 6; PMS2, postmeiotic segregation increased 2; FFPE, formalin-fixed paraffin-embedded.
Author contributions
N.T., T.G. and Y.H. wrote the manuscript. T.G., T.N., D.S., R.H., and Y.Y. performed the surgery. T.O. carried out the pathological examination. Y.H., K.A., T.G., T.N., Y.Y., K.O., H.M., and M.O. participated in the genomic analyses. M.O. and Y.H. edited the final manuscript. All authors have read and approved the final version for submission.
ACKNOWLEDGMENTS
We thank Hidetoshi Shigetomo, Yumi Kubota, and Ritsuko Yokouchi for their help.
CONFLICTS OF INTEREST
The authors declare that there are no conflicts of interest.
FUNDING
This study was supported by a Grant-in-Aid for Genome Research Project from Yamanashi Prefecture (awarded to Y.H. and M.O.) and a grant from the Yasuda Medical Foundation (awarded to Y.H.).
REFERENCES
1. Travis WD, Brambilla E, Burke AP, Marx A, Nicholson AG. Introduction to the 2015 world health organization classification of tumors of the lung, pleura, thymus, and heart. J Thorac Oncol. 2015; 10:1240–1242.
2. Vieira T, Girard N, Ung M, Monnet I, Cazes A, Bonnette P, Duruisseaux M, Mazieres J, Antoine M, Cadranel J, Wislez M. Efficacy of first-line chemotherapy in patients with advanced lung sarcomatoid carcinoma. J Thorac Oncol. 2013; 8:1574–1577.
3. Yendamuri S, Caty L, Pine M, Adem S, Bogner P, Miller A, Demmy TL, Groman A, Reid M. Outcomes of sarcomatoid carcinoma of the lung: a surveillance, epidemiology, and end results database analysis. Surgery. 2012; 152:397–402.
4. Blaukovitsch M, Halbwedl I, Kothmaier H, Gogg-Kammerer M, Popper HH. Sarcomatoid carcinomas of the lung--are these histogenetically heterogeneous tumors? Virchows Arch. 2006; 449:455–461.
5. Fallet V, Saffroy R, Girard N, Mazieres J, Lantuejoul S, Vieira T, Rouquette I, Thivolet-Bejui F, Ung M, Poulot V, Schlick L, Moro-Sibilot D, Antoine M, et al. High-throughput somatic mutation profiling in pulmonary sarcomatoid carcinomas using the lungcarta panel: exploring therapeutic targets. Ann Oncol. 2015; 26:1748–1753.
6. Goto T, Hirotsu Y, Mochizuki H, Nakagomi T, Oyama T, Amemiya K, Omata M. Stepwise addition of genetic changes correlated with histological change from “well-differentiated” to “sarcomatoid” phenotypes: a case report. BMC Cancer. 2017; 17:65.
7. Pelosi G, Scarpa A, Manzotti M, Veronesi G, Spaggiari L, Fraggetta F, Nappi O, Benini E, Pasini F, Antonello D, Iannucci A, Maisonneuve P, Viale G. K-ras gene mutational analysis supports a monoclonal origin of biphasic pleomorphic carcinoma of the lung. Mod Pathol. 2004; 17:538–546.
8. Tamura K, Nei M, Kumar S. Prospects for inferring very large phylogenies by using the neighbor-joining method. Proc Natl Acad Sci U S A. 2004; 101:11030–11035.
9. Rizvi NA, Hellmann MD, Snyder A, Kvistborg P, Makarov V, Havel JJ, Lee W, Yuan J, Wong P, Ho TS, Miller ML, Rekhtman N, Moreira AL, et al. Cancer immunology. mutational landscape determines sensitivity to PD-1 blockade in non-small cell lung cancer. Science. 2015; 348:124–128.
10. Le DT, Uram JN, Wang H, Bartlett BR, Kemberling H, Eyring AD, Skora AD, Luber BS, Azad NS, Laheru D, Biedrzycki B, Donehower RC, Zaheer A, et al. PD-1 blockade in tumors with mismatch-repair deficiency. N Engl J Med. 2015; 372:2509–2520.
11. Geynisman DM. Anti-programmed cell death protein 1 (PD-1) antibody nivolumab leads to a dramatic and rapid response in papillary renal cell carcinoma with sarcomatoid and rhabdoid features. Eur Urol. 2015; 68:912–914.
12. Joseph RW, Millis SZ, Carballido EM, Bryant D, Gatalica Z, Reddy S, Bryce AH, Vogelzang NJ, Stanton ML, Castle EP, Ho TH. PD-1 and PD-L1 expression in renal cell carcinoma with sarcomatoid differentiation. Cancer Immunol Res. 2015; 3:1303–1307.
13. Shah SN, Hile SE, Eckert KA. Defective mismatch repair, microsatellite mutation bias, and variability in clinical cancer phenotypes. Cancer Res. 2010; 70:431–435.
14. Lujan SA, Williams JS, Pursell ZF, Abdulovic-Cui AA, Clark AB, Nick McElhinny SA, Kunkel TA. Mismatch repair balances leading and lagging strand dna replication fidelity. PLoS Genet. 2012; 8:e1003016.
15. Poulogiannis G, Frayling IM, Arends MJ. DNA mismatch repair deficiency in sporadic colorectal cancer and lynch syndrome. Histopathology. 2010; 56:167–179.
16. Stoehr C, Burger M, Stoehr R, Bertz S, Ruemmele P, Hofstaedter F, Denzinger S, Wieland WF, Hartmann A, Walter B. Mismatch repair proteins hMLH1 and hMSH2 are differently expressed in the three main subtypes of sporadic renal cell carcinoma. Pathobiology. 2012; 79:162–168.
17. Timmermann B, Kerick M, Roehr C, Fischer A, Isau M, Boerno ST, Wunderlich A, Barmeyer C, Seemann P, Koenig J, Lappe M, Kuss AW, Garshasbi M, et al. Somatic mutation profiles of MSI and MSS colorectal cancer identified by whole exome next generation sequencing and bioinformatics analysis. PLos One. 2010; 5:e15661.
18. Cancer Genome Atlas Network. Comprehensive molecular characterization of human colon and rectal cancer. Nature. 2012; 487:330–337.
19. Agaram NP, Shia J, Tang LH, Klimstra DS. DNA mismatch repair deficiency in ampullary carcinoma: a morphologic and immunohistochemical study of 54 cases. Am J Clin Pathol. 2010; 133:772–780.
20. Cancer Genome Atlas Research Network. Comprehensive molecular characterization of gastric adenocarcinoma. Nature. 2014; 513:202–209.
21. Kandoth C, Schultz N, Cherniack AD, Akbani R, Liu Y, Shen H, Robertson AG, Pashtan I, Shen R, Benz CC, Yau C, Laird PW, et al; Cancer Genome Atlas Research Network. Integrated genomic characterization of endometrial carcinoma. Nature. 2013; 497:67–73.
22. Garg K, Leitao MM Jr, Kauff ND, Hansen J, Kosarin K, Shia J, Soslow RA. Selection of endometrial carcinomas for DNA mismatch repair protein immunohistochemistry using patient age and tumor morphology enhances detection of mismatch repair abnormalities. Am J Surg Pathol. 2009; 33:925–933.
23. Maple JT, Smyrk TC, Boardman LA, Johnson RA, Thibodeau SN, Chari ST. Defective dna mismatch repair in long-term (> or =3 years) survivors with pancreatic cancer. Pancreatology. 2005; 5:220–227; discussion 227-228.
24. Nakata B, Wang YQ, Yashiro M, Nishioka N, Tanaka H, Ohira M, Ishikawa T, Nishino H, Hirakawa K. Prognostic value of microsatellite instability in resectable pancreatic cancer. Clin Cancer Res. 2002; 8:2536–2540.
25. Snyder A, Makarov V, Merghoub T, Yuan J, Zaretsky JM, Desrichard A, Walsh LA, Postow MA, Wong P, Ho TS, Hollmann TJ, Bruggeman C, Kannan K, et al. Genetic basis for clinical response to CTLA-4 blockade in melanoma. N Engl J Med. 2014; 371:2189–2199.
26. Williams AS, Huang WY. The analysis of microsatellite instability in extracolonic gastrointestinal malignancy. Pathology. 2013; 45:540–552.
27. Seng TJ, Currey N, Cooper WA, Lee CS, Chan C, Horvath L, Sutherland RL, Kennedy C, McCaughan B, Kohonen-Corish MR. DLEC1 and MLH1 promoter methylation are associated with poor prognosis in non-small cell lung carcinoma. Br J Cancer. 2008; 99:375–382.
28. Warth A, Korner S, Penzel R, Muley T, Dienemann H, Schirmacher P, von Knebel-Doeberitz M, Weichert W, Kloor M. Microsatellite instability in pulmonary adenocarcinomas: a comprehensive study of 480 cases. Virchows Arch. 2016; 468:313–319.
29. Okazaki T, Chikuma S, Iwai Y, Fagarasan S, Honjo T. A rheostat for immune responses: the unique properties of PD-1 and their advantages for clinical application. Nat Immunol. 2013; 14:1212–1218.
30. Garon EB, Rizvi NA, Hui R, Leighl N, Balmanoukian AS, Eder JP, Patnaik A, Aggarwal C, Gubens M, Horn L, Carcereny E, Ahn MJ, Felip E, et al. Pembrolizumab for the treatment of non-small-cell lung cancer. N Engl J Med. 2015; 372:2018–2028.
31. Herbst RS, Soria JC, Kowanetz M, Fine GD, Hamid O, Gordon MS, Sosman JA, McDermott DF, Powderly JD, Gettinger SN, Kohrt HE, Horn L, Lawrence DP, et al. Predictive correlates of response to the anti-PD-L1 antibody MPDL3280A in cancer patients. Nature. 2014; 515:563–567.
32. Taube JM, Klein A, Brahmer JR, Xu H, Pan X, Kim JH, Chen L, Pardoll DM, Topalian SL, Anders RA. Association of PD-1, PD-1 ligands, and other features of the tumor immune microenvironment with response to anti-PD-1 therapy. Clin Cancer Res. 2014; 20:5064–5074.
33. Reck M, Rodriguez-Abreu D, Robinson AG, Hui R, Csoszi T, Fulop A, Gottfried M, Peled N, Tafreshi A, Cuffe S, O’Brien M, Rao S, Hotta K, et al. Pembrolizumab versus chemotherapy for PD-L1-positive non-small-cell lung cancer. N Engl J Med. 2016; 375:1823–1833.
34. Amemiya K, Hirotsu Y, Goto T, Nakagomi H, Mochizuki H, Oyama T, Omata M. Touch imprint cytology with massively parallel sequencing (TIC-seq): A simple and rapid method to snapshot genetic alterations in tumors. Cancer Med. 2016; 5:3426–3436.
35. Cancer Genome Atlas Research Network. Comprehensive molecular profiling of lung adenocarcinoma. Nature. 2014; 511:543–550.
36. Cancer Genome Atlas Research Network. Comprehensive genomic characterization of squamous cell lung cancers. Nature. 2012; 489:519–525.
37. Clinical Lung Cancer Genome Project (CLCGP), Network Genomic Medicine (NGM). A genomics-based classification of human lung tumors. Sci Transl Med. 2013; 5:209ra153.
38. Rudin CM, Durinck S, Stawiski EW, Poirier JT, Modrusan Z, Shames DS, Bergbower EA, Guan Y, Shin J, Guillory J, Rivers CS, Foo CK, Bhatt D, et al. Comprehensive genomic analysis identifies SOX2 as a frequently amplified gene in small-cell lung cancer. Nat Genet. 2012; 44:1111–1116.
39. Peifer M, Fernandez-Cuesta L, Sos ML, George J, Seidel D, Kasper LH, Plenker D, Leenders F, Sun R, Zander T, Menon R, Koker M, Dahmen I, et al. Integrative genome analyses identify key somatic driver mutations of small-cell lung cancer. Nat Genet. 2012; 44:1104–1110.
40. Imielinski M, Berger AH, Hammerman PS, Hernandez B, Pugh TJ, Hodis E, Cho J, Suh J, Capelletti M, Sivachenko A, Sougnez C, Auclair D, Lawrence MS, et al. Mapping the hallmarks of lung adenocarcinoma with massively parallel sequencing. Cell. 2012; 150:1107–1120.
41. Govindan R, Ding L, Griffith M, Subramanian J, Dees ND, Kanchi KL, Maher CA, Fulton R, Fulton L, Wallis J, Chen K, Walker J, McDonald S, et al. Genomic landscape of non-small cell lung cancer in smokers and never-smokers. Cell. 2012; 150:1121–1134.
42. Goto T, Hirotsu Y, Mochizuki H, Nakagomi T, Shikata D, Yokoyama Y, Oyama T, Amemiya K, Okimoto K, Omata M. Mutational analysis of multiple lung cancers: discrimination between primary and metastatic lung cancers by genomic profile. Oncotarget. 2017; 8:31133–31143. https://doi.org/10.18632/oncotarget.16096.
43. Goto T, Hirotsu Y, Oyama T, Amemiya K, Omata M. Analysis of tumor-derived dna in plasma and bone marrow fluid in lung cancer patients. Med Oncol. 2016; 33:29.
44. Goto T, Hirotsu Y, Nakagomi T, Shikata D, Yokoyama Y, Amemiya K, Tsutsui T, Kakizaki Y, Oyama T, Mochizuki H, Miyashita Y, Omata M. Detection of tumor-derived DNA dispersed in the airway improves the diagnostic accuracy of bronchoscopy for lung cancer. Oncotarget. 2017; 8:79404–79413. https://doi.org/10.18632/oncotarget.18159.
45. Hirotsu Y, Kojima Y, Okimoto K, Amemiya K, Mochizuki H, Omata M. Comparison between two amplicon-based sequencing panels of different scales in the detection of somatic mutations associated with gastric cancer. BMC Genomics. 2016; 17:833.
46. Saitou N, Nei M. The neighbor-joining method: a new method for reconstructing phylogenetic trees. Mol Biol Evol. 1987; 4:406–425.
47. Roth A, Khattra J, Yap D, Wan A, Laks E, Biele J, Ha G, Aparicio S, Bouchard-Cote A, Shah SP. Pyclone: statistical inference of clonal population structure in cancer. Nat Methods. 2014; 11:396–398.
48. Berg KD, Glaser CL, Thompson RE, Hamilton SR, Griffin CA, Eshleman JR. Detection of microsatellite instability by fluorescence multiplex polymerase chain reaction. J Mol Diagn. 2000; 2:20–28.
49. Hirotsu Y, Nakagomi H, Sakamoto I, Amemiya K, Oyama T, Mochizuki H, Omata M. Multigene panel analysis identified germline mutations of dna repair genes in breast and ovarian cancer. Mol Genet Genomic Med. 2015; 3:459–466.
50. Lindor NM, Burgart LJ, Leontovich O, Goldberg RM, Cunningham JM, Sargent DJ, Walsh-Vockley C, Petersen GM, Walsh MD, Leggett BA, Young JP, Barker MA, Jass JR, et al. Immunohistochemistry versus microsatellite instability testing in phenotyping colorectal tumors. J Clin Oncol. 2002; 20:1043–1048.