
INTRODUCTION
Copper (Cu) homeostasis is emerging as crucial in many metabolic disorders, as well as in cancer [1–4]. Cu can be found in a oxidized (Cu II) and a reduced (Cu I) state: the latter is transported inside the cell by the high affinity copper transporter CTR1, predominantly found on plasma membrane, and encoded by the SLC31A1 gene [5, 6]. The two different forms of Cu are important for cellular antioxidant defense and mitochondrial respiration [7]. Free copper is mainly bound to the metal-binding protein ceruloplasmin (Cp), primarily synthesized in the liver [8]. Copper, in its “free” and “unbound” form, becomes toxic by acting as pro-oxidant, contributing to the formation of toxic reactive oxygen species (ROS) and altering the functions of some important biomolecules (i.e. lipids and proteins) [9]. Accordingly, Cu metabolism results significantly altered in chronic and neoplastic diseases [10–11]. Interestingly, serum Cu concentration correlates with hepatocellular carcinoma (HCC) incidence and progression [12].
Growing evidences suggest that, in western countries, NAFLD is becoming a major cause of liver damage progression and HCC incidence [13]. Increased oxidative stress is considered a key trigger in the pathogenesis of this disease and one of the enzymes counteracting oxidative stress, Cu/Zn superoxide dismutase (SOD) depends on adequate copper availability, suggesting a potential link between copper and impaired antioxidant defense in NAFLD. The majority of deaths in patients with NAFLD are, first, attributed to cardiovascular events, and, second to malignancies at gastrointestinal site (liver, colon, esophagus, stomach, and pancreas), while end-stage liver disease is the third cause of death [14].
Most of HCC patients are diagnosed at advanced stages-despite the impressive improvements in imaging techniques-and are characterized by a poor prognosis [15, 16]. Thus, new biomarkers with better diagnostic potential, as well as prognostic value for the assessment of the progression of cirrhosis to HCC, are urgently needed. Furthermore, despite the huge number of studies attempting to improve treatments, currently there are not specific anti-tumoral therapies effective for HCC patients, ineligible to radical treatments. Sorafenib, an orally active multikinase inhibitor, is the only approved drug in the European Union for patients with advanced HCC, who are not candidates for potentially curative treatment or transcatheter arterial chemoembolization (TACE), but unfortunately it prolongs survival for less than 3 months [17]. Therefore, new information on HCC pathogenesis will open new opportunities in the diagnosis and design of patient-tailored therapies. Local invasion and metastasis are important manifestations of advanced HCC and are related to the epithelial-mesenchymal transition (EMT), one of the key processes of tumor progression [18]. The main feature of EMT is the decrease of cell adhesion molecules, such as E-cadherin, and the increase of cytoskeletal proteins like β-catenin, giving to cells mesenchymal like morphology [19]. Through EMT, epithelial cells lose polarity and decrease the connection with the basement membrane, acquiring the ability to migrate and invade the surrounding tissue [18].
c-MYC (MYC) has a pivotal role in cell transformation and EMT modulation [20, 21] and represents one of the most relevant targets for cancer treatment, as demonstrated by studies in animal models employing Omomyc, a MYC interfering molecule [22], or employing drugs that affect MYC transcription [23].
Here, we looked at copper levels in NAFLD-cirrhotic and -HCC patients, highlighting higher serum copper concentrations in presence of liver cancer. Furthermore, we studied the biological effects of growing extracellular copper amounts on HepaRG and HepG2 liver cell lines.
Our data highlight a still unknown interplay between copper, MYC and CTR1.
RESULTS
Concentration of copper in serum of NAFLD-cirrhotic and -HCC patients
We measured copper concentration in sera of 20 NAFLD-cirrhotic, 9 NAFLD-HCC patients and 20 control healthy donors (HD) (Figure 1A, Table 1). NAFLD-cirrhotic patients were characterized by a statistical significant enhancement of serum copper levels compared to HD (151.42 ± 30.83 μg/dl vs 92.14 ± 15.74 μg/dl; P < 0.001), and a further significant increase of cupremia was detected in presence of HCC (181.43 ± 13.03 μg/dl vs cirrhotic patients; P < 0.01) (Figure 1A). ROC curve analysis revealed that copper could be considered a biomarker to distinguish HCC from cirrhotic patients, since the area under ROC curve (AUC) was 0.8611 (95% CI, 0.7245–0.9977; P < 0.01). We identified 163.3 μg/dl as copper cut off value with 65% of Sensitivity and 88.89% of Specificity (Figure 1B).
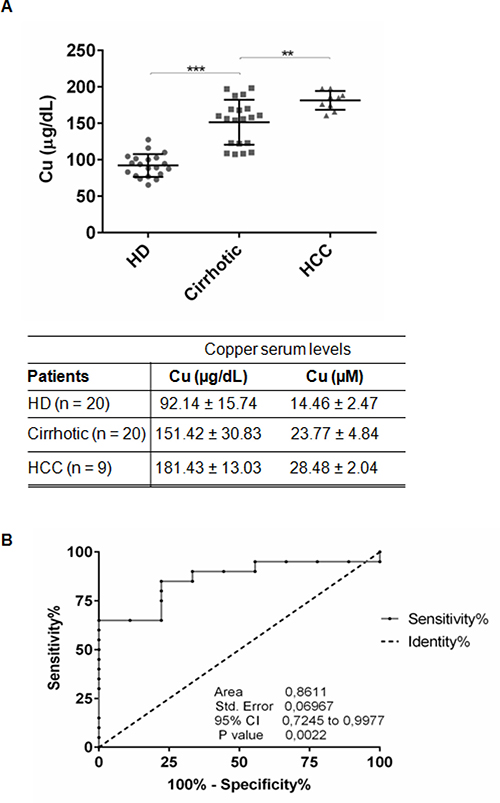
Figure 1: Serum copper level in cirrhotic and HCC patients. (A) Copper level in serum of HD (n = 20), Cirrhotic (n = 20) and HCC (n = 9) patients quantified by atomic absorption spectroscopy. The results are represented as mean values ± SD. (**P < 0.01 and ***P < 0.001). (B) Sensitivity and Specificity ROC curve based on copper serum levels in HCC versus cirrhotic patients.
Table 1: Antropometric and serum biochemical parameters
Parameters |
HD (n = 20) |
Cirrhotic (n = 20) |
HCC (n = 9) |
|---|---|---|---|
Sex (F/M) |
7/13 |
8/12 |
1/8 |
Age (years) |
41.65 ± 10.95 |
64.8 ± 9.7 |
68.6 ± 8.06 |
BMI (kg/m2) (≤25) |
22.4 ± 1.68 |
31.7 ± 3.07*** |
25.06 ± 6.2* |
ALT (10–40 IU/mL) |
26.7 ± 6.35 |
68.73 ± 24.6*** |
40.1 ± 19.9** |
AST (9–45 IU/mL) |
20.86 ± 5.43 |
32.33 ± 8.9*** |
51.33 ± 42.9** |
GGT (5–38 IU/mL) |
24.5 ± 7.9 |
70.65 ± 15.27*** |
103.6 ± 80.40*** |
FA (40–129 IU/L) |
72.85 ± 37.01 |
113.6 ± 67.3* |
290.8 ± 309.5** |
Cu (μg/dL) |
92.14 ± 15.7 |
151.4 ± 26.8*** |
181.4 ± 13.8*** |
Antropometric and serum biochemical parameters of healthy donors (HD), NAFLD cirrhotic and HCC patients. Abbreviation: F, females; M, males; BMI, Body Mass Index; IU, international units; ALT, alanine transaminase; AST, aspartate transaminase; GGT, Gamma-glutamyl transferase; FA, Alkalinfosfatase; Cu, copper. Brackets contain normal values. P value has been calculated respect to HD (*P < 0.05; **P < 0.01 and ***P < 0.001).
Then, we performed statistical correlations between copper and biochemical parameters of NAFLD-cirrhotic and -HCC patients. Even if a positive trend was highlighted with AST, GGT, FA and a negative trend with ALT and TGs, a significant negative correlation has been appreciated only between copper and cholesterol serum levels (Supplementary Figure 1).
Copper promotes cell proliferation
We firstly evaluated the effect of exogenous copper on viability of HepaRG and HepG2 cells. We performed a dose/time curve with different concentrations of CuSO4 (5–100 μM) (Figure 2A). Copper treatment induced an increase of cell viability in both cell lines, especially at 96 hrs (Figure 2A). Based on these data, from now on, we decided to perform all the experiments at 96 hrs.
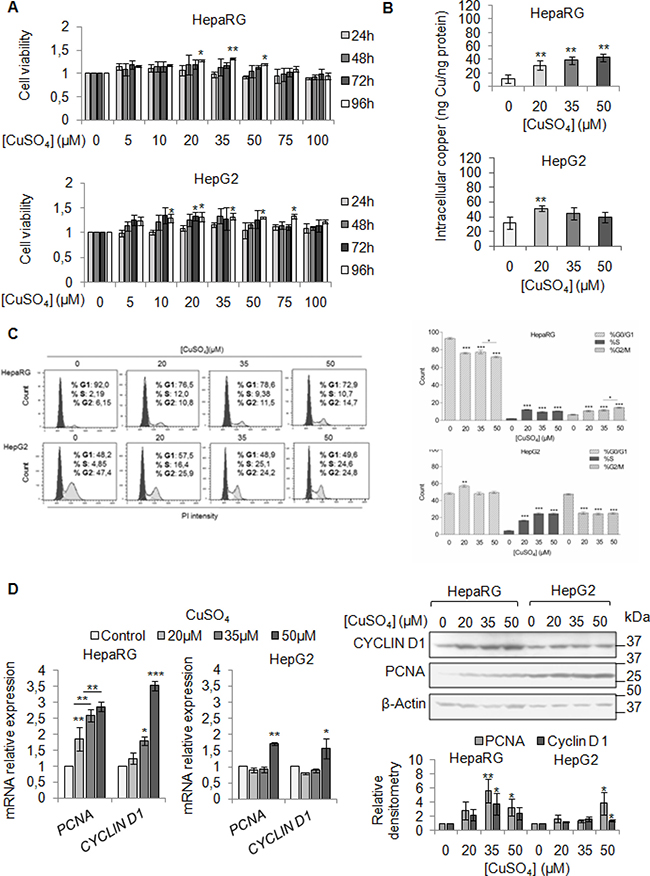
Figure 2: Copper promotes cell proliferation in liver cells. (A) Relative cell viability evaluated by MTS assay. Relative cell viability of treated cells has been evaluated respect to untreated cells, considered as 0. The results, derived from five independent experiments, are represented as mean ± SD. (B) Intracellular copper levels assayed by atomic absorption spectroscopy after 96 hrs of 20, 35 and 50 μM CuSO4 treatment. Values are expressed as mean ± SD. (*P < 0.05 and **P < 0.01; n = 5). (C) Left: Representative distribution of control and treated cells with CuSO4 (in serum free medium) in G0/G1, S and G2/M phases of cell cycle done by Propidium Iodide (PI) staining and flow cytometric analysis. Right: Histograms reported the values as mean ± SD. (*P < 0.05; **P < 0.01; ***P < 0.001; n = 3). (D) Relative mRNA expression (Left), representative western blot (Top, Right) and the relative densitomentric analysis (Bottom, Right) of PCNA and Cyclin D1 in Control and copper treated cells. Values are expressed as mean ± SD. (*P < 0.05 and **P < 0.01; n = 3).
Since our patients displayed serum copper levels between 20 and 30 μM, and the best CuSO4 concentrations, in in vitro experiments, appeared to be between 20 and 35 μM, we decided to use the following concentrations of CuSO4: 20, 35 and 50 μM. Copper treatment induced a significant increase of intracellular copper levels, in both cell lines (Figure 2B). The cell cycle analyses of starved liver cells stimulated by increasing copper concentrations, revealed a higher number of cells in S phase (Figure 2C), without increasing cell death (Supplementary Figure 2). The up-regulation of mRNA and protein levels of PCNA and Cyclin D1 confirmed the pro-proliferative effects of copper (Figure 2D), whereas, the increased number of cells in G2/M was associated with increased expression of Cyclin B1 and Cyclin A (Supplementary Figure 3).
Copper and MYC interaction
Aware that most of HCCs over-express MYC [24, 25], a critical regulator of cellular growth, we looked at MYC mRNA expression levels before and after copper stimuli (Figure 3A and 3B). We highlighted a positive correlation between basal intracellular levels of copper and MYC expression (Figure 3A), as well as an induction of MYC expression after copper stimuli (Figure 3B). Densitometric analyses for all the immunoblots presented in this manuscript has been reported in supplementary data (Supplementary Figure 4).
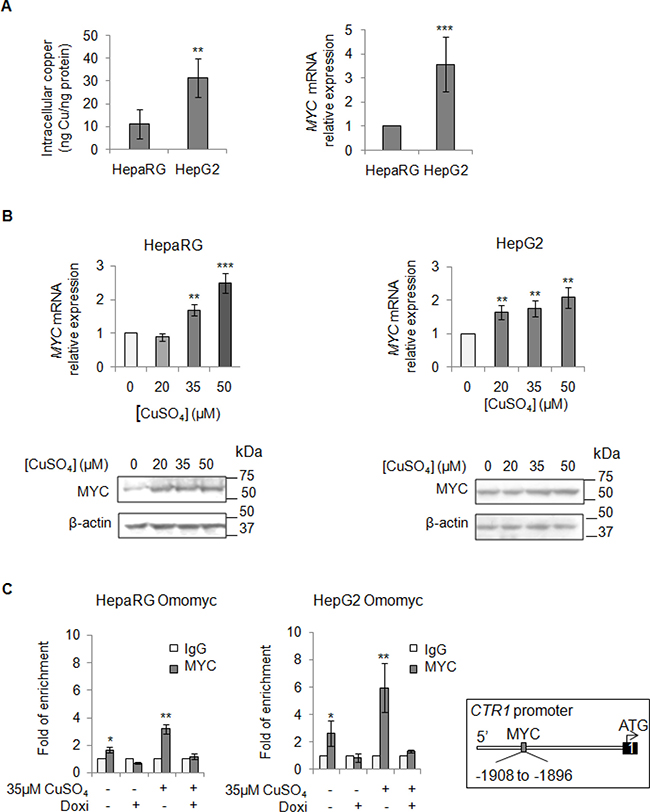
Figure 3: Direct interaction between MYC and CTR1. (A) Left: Basal intracellular copper levels assayed by atomic absorption spectroscopy in HepaRg and HepG2 cells. Right: relative mRNA expression of MYC in HepG2 and HepaRG cells. Values are expressed as mean ± SD. (**P < 0.01 and ***P < 0.001; n = 5). (B) Relative mRNA expression and representative western blots of MYC in HepaRG (Left) and HepG2 (Right) cells after 20, 35 and 50 μM CuSO4 treatment (96 hrs). Values are expressed as fold mean ± SD. (**P < 0.01; n = 3). (C) MYC binding to the CTR1 promoter region, assayed by ChIP, after induction of Omomyc by doxycyclin (Doxi), before and after treatment with 35 μM CuSO4 (96 hrs). Values are expressed as fold mean ± SD of three independent experiments (*P < 0.05 and **P < 0.01). IgG was used as negative ChIP control. Right: Schematic representation of the MYC binding consensus sequences on the CTR1 promoter.
However, since copper is important for cellular antioxidant defense and mitochondrial respiration, to further improve the relevance of specific copper-related effects on MYC induction, we evaluated, in both cell lines, the extent of oxidative stress in presence of increasing copper concentrations (20–100 μM CuSO4) (Supplementary Figure 5). Copper treatment induced an increase of MYC protein amount (Supplementary Figure 5A) that was associated with an increase of ROS (Supplementary Figure 5B and 5C), detected by using 2′, 7′-dichlorodihydrofluorescein diacetate (H2DCF-DA) fluorescent probe.
After that, we investigated the effect of Hydrogen peroxide (H2O2) on MYC expression in correlation with ROS production (Supplementary Figure 5E and 5F). Interestingly, H2O2 treatment, contrary to copper, determined a relevant down-regulation of MYC protein levels in HepaRG cells (Supplementary Figure 5D).
These data prompted us to study if MYC could modulate the expression of CTR1, the main copper transporter protein responsible for the influx of reduced copper ions across cell membrane. Thus, we investigated if MYC might bind to the CTR1 promoter region (Figure 3C). For this purpose, liver cell lines were stably transfected with Omomyc, a dominant negative of MYC, here used as negative control. Omomyc was chosen because it impairs the bind of MYC/MAX complex to DNA-recognizing E-boxes -, thus working as a transcriptional inhibitor [22]. After that, we performed a Chromatin Immunoprecipitation (ChIP) assay, using a specific anti-MYC antibody to precipitate chromatin fragments from controls and Omomyc HepaRG and HepG2 cells, in presence or absence of exogenous copper. Copper caused a higher MYC binding to CTR1 promoter (3.2 and 5.9 folds in HepaRG and HepG2 cells, respectively) respect to the control, while any binding was observed in presence of Omomyc (Figure 3C). These results highlighted a direct interaction between MYC and CTR1 promoter, mediated by the MYC binding consensus sequence (AGAGCACATGGCT) located between -1908 and -1896 of the transcription start site of CTR1 promoter region.
To understand how spread is the copper activity on MYC, we tested beyond CTR1, by ChIP experiments, other c-MYC target genes, known to be important for cell proliferation and invasion: CAD (carbamoyl-phosphate synthetase 2) and Cyclin D1 proteins. Copper treatment increased MYC binding at CAD and Cyclin D1 promoters respect to the control, while this interaction was absent in presence of Omomyc (Supplementary Figure 6).
CTR1 and MYC expression in in vitro and in vivo experiments
We evaluated the baseline gene expression of CTR1 in the two cell lines, which resulted higher in HepG2 than in HepaRG (Figure 4A). Unexpectedly, copper treatment caused an increase of CTR1 transcription only in HepaRG, but not in HepG2 cells (Figure 4B). However, since it is well known that CTR1 protein is down-regulated to avoid excessive intracellular copper entry, accordingly with data reported in literature [26], copper, at the highest concentrations (35 and 50 μM), determined a down-regulation of the CTR1 protein levels, in both cell lines (Figure 4B). Further studies are needed to understand the fine differences existing between less or more differentiated transformed liver cells, such as HepG2 and HepaRG cells.
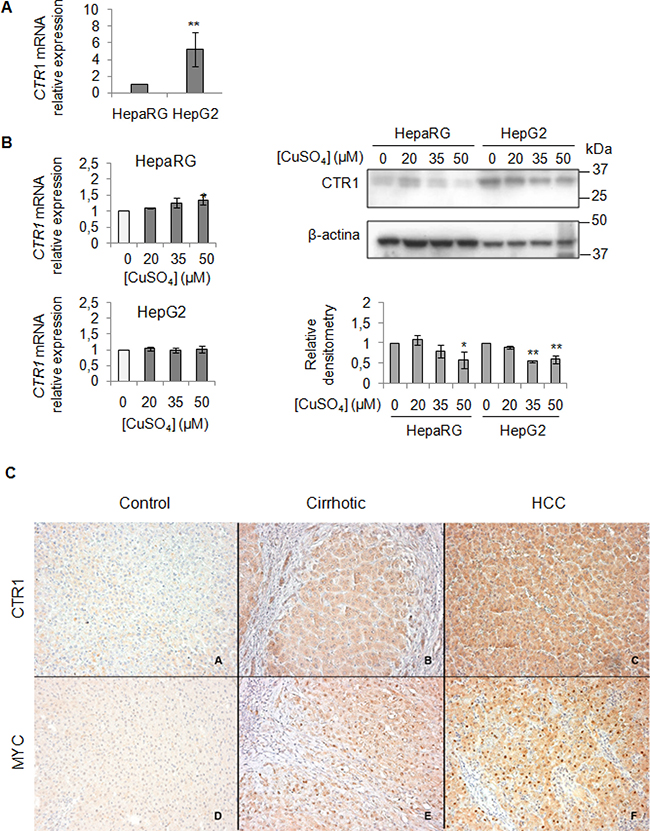
Figure 4: Exogenous copper modulates CTR1 and MYC protein expression (A) Relative mRNA expression of CTR1 measured by RT-PCR in HepG2 respect to HepaRG. Values are expressed as fold mean ± SD. (**P < 0.01; n = 5). (B) Left: Relative mRNA expression of CTR1 in both cells after 96 hrs of copper treatment. Right: Representative western blot of CTR1 and relative densitometry of three independent experiments. Values are expressed as fold mean ± SD. (*P < 0.05 and **P < 0.01; n = 3). (C) Immunohistochemical analysis of CTR1 and MYC protein expression. Panels A and D: two representative cases of normal liver tissue; Panels B and E: liver cirrhotic tissues. Panel C and F: hepatocellular carcinoma tissues. Avidin-Biotin-Peroxidase complex method in paraffin sections lightly counterstained with ematoxylin. Original magnification 200×
To validate the role of the MYC/CTR1 axis in HCC, we assessed the expression of MYC and CTR1 in normal, NAFLD-cirrhotic and -HCC tissues by using immunohistochemical staining (Figure 4C). Normal liver tissue expressed very low level of CTR1 (Figure 4C, panel A), whereas MYC was undetectable (Figure 4C, panel D). CTR1 expression progressively increased either in cell membrane or in the cytoplasm from cirrhotic (Figure 4C, panel B) toward HCC tissues (Figure 4C, panel C). On the other hand, MYC protein displayed moderate nuclear expression in cirrhotic tissues (Figure 4C, panel E) that strongly increased in HCC tissues (Figure 4C, panel F).
After that, we looked at CTR1 expression in stable Omomyc expressing cells. Notably, the CTR1 mRNA and protein amounts decreased in parallel with the reduction of MYC expression (Figure 5A), causing in turn a significant decrease of intracellular copper concentrations (Figure 5B). However, if copper was added again, despite the presence of Omomyc, it was able to partially restore the expression of MYC and to slightly increase the intracellular copper content (Figure 5A and 5B, respectively). Interestingly, stable Omomyc expressing cells displayed a significant decrease of the intracellular copper concentrations (Figure 5B).
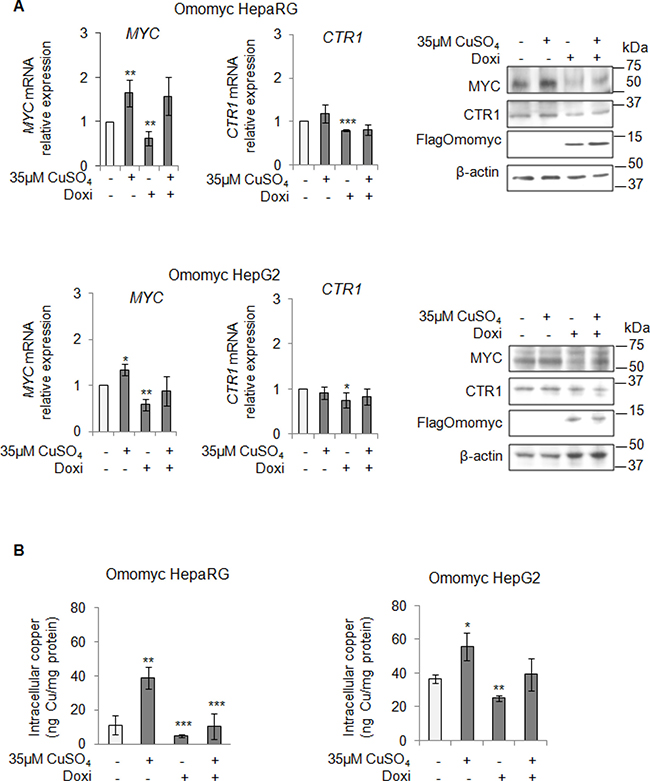
Figure 5: MYC modulates the intracellular copper homeostasis. (A) Relative mRNA expression (Left) and representative western blots (Right) of MYC, CTR1 and FlagOmomyc in Omomyc HepaRG (Top) and HepG2 (Bottom) cells before and after induction of Omomyc by doxycyclin (Doxi), treated or not with 35 μM CuSO4 (96 hrs). Values are expressed as fold mean ± SD. (*P < 0.05; **P < 0.01 and ***P < 0.001; n = 3). (B) Intracellular copper levels in Omomyc HepaRG (Left) and HepG2 (Right) cells in the same experimental condition described above. Values are expressed as fold mean ± SD. (*P < 0.05; **P < 0.01 and ***P < 0.001; n = 3).
Omomyc partially counteracts the copper related biological effects
To understand if the inhibition of the copper/MYC interplay might be effective in lessening the copper-related tumorigenic effects, firstly, we looked at the ability of Omomyc in counteracting the copper-related increased proliferation of HepaRG and HepG2 cells. In both cell lines, Omomyc caused an accumulation of cells in G2/M phase and a decrease of cells in S phase (Figure 6A and 6C). A further stimulus with 35 μM CuSO4, partially restored proliferation in both cell lines, regardless the presence of Omomyc (Figure 6A and 6C). Accordingly, PCNA and Cyclin D1 mRNA and protein levels (Figure 6B and 6D) were down-regulated by Omomyc, but upon copper treatment their expression was up-regulated again.
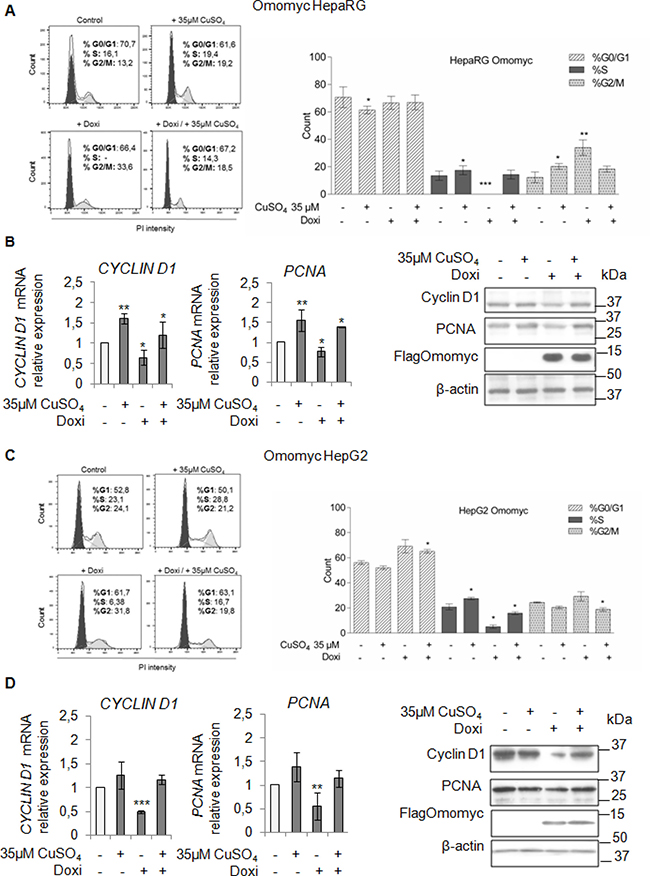
Figure 6: Omomyc and copper-induced proliferation. (A and C) Left: Representative distribution plot of HepaRG (A) and HepG2 (C), after induction of Omomyc by doxycyclin (Doxi), before and after treatment with 35 μM CuSO4 (96 hrs), in G0/G1, S and G2/M phases of the cell cycle analysed by PI staining and flow cytometric analysis. Right: Histograms reported values as mean ± SD (*P < 0.05; **P < 0.01; ***P < 0.001; n = 3). (B and D) Relative mRNA expression (Left) and representative western blots (Right) of Cyclin D1, PCNA and FlagOmomyc in HepaRG (B) and HepG2 (D) cells in the same experimental condition described above (*P < 0.05; **P < 0.01; ***P < 0.001; n = 3).
Finally, we performed a migration and invasion assay in starved cells to observe if copper by itself could promote cell mobilization, too. Copper treatment pushed HepaRG (Figure 7A and 7B) and HepG2 cells (Figure 8A and 8B) to migrate and to invade the extracellular matrix. Accordingly, E-cadherin was decreased while β-catenin was up-regulated (Figure 7C and Figure 8C). In addition, the transcription of c-KIT, THY1 and NCAM, specific proteins related to the Epithelial Mesenchimal Transition (EMT) in HepaRG cells, was up-regulated (Supplementary Figure 7). Omomyc was able, to totally revert the copper-dependent pro-invasive effect, in both cell lines, inducing a post-transcriptional regulation of E-cadherin and β-catenin (Figure 7D and 7E, Figure 8D and 8E).
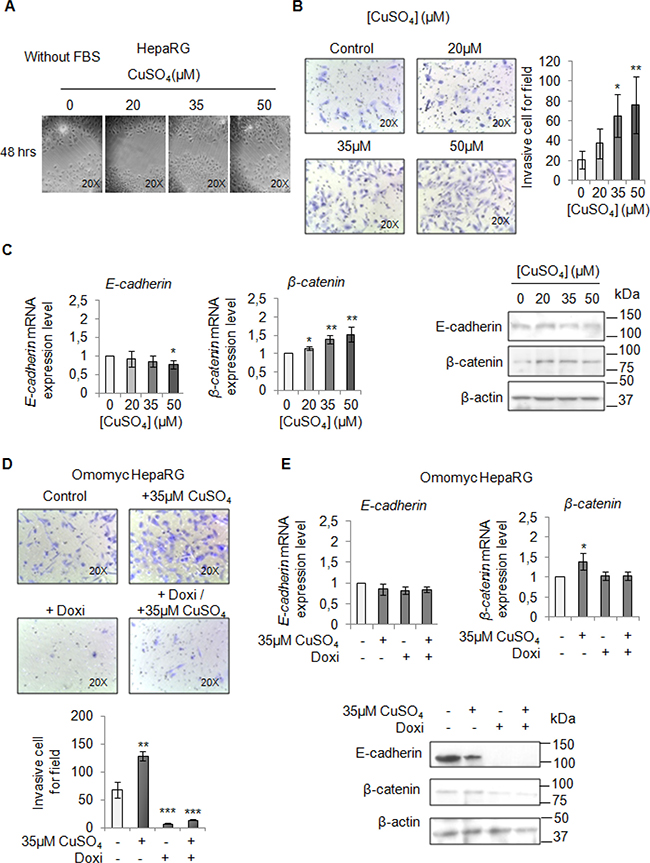
Figure 7: Copper promotes HepaRG invasion by MYC. (A) Analysis of cell migration by a wound-healing assay in control and CuSO4 treated HepaRG cells. Representative microphotographs taken at 48 hrs post-wound (×20). (B) Transwell migration assay in HepaRG cells treated with copper for 48 hrs, in serum free medium. Left: Representative microphotographs of crystal violet stained cells migrated to the bottom membrane of transwell (×20). Right: Quantification of the number of migratory cells, that were counted in 5 non-overlapping random fields of the membrane. Values are expressed as fold mean ± SD. (*P < 0.05 and **P < 0.01; n = 3). (C) Relative mRNA expression (Left) and representative western blots (Right) of E-cadherin and β-catenin in HepaRG treated with CuSO4 up to 96 hrs. Values are expressed as fold mean ± SD. (*P < 0.05; n = 3). (D) Transwell migration assay in Omomyc HepaRG cells performed in a serum-supplemented medium, after induction of Omomyc by doxycyclin (Doxi), before and after treatment with 35 μM CuSO4 (48 hrs). Top: Representative microphotographs of crystal violet stained cells attached to the bottom membrane of a transwell (×20). Bottom: Quantification of the number of migratory cells using the transwell assay. Migratory cells were counted in five non-overlapping random fields of the membrane. Values are expressed as fold mean ± SD. (*P < 0.05 and ***P < 0.001; n = 3). (E) Relative mRNA expression (Top) and representative western blots (Bottom) of E-cadherin and β-catenin in Omomyc HepaRG cells treated or not with copper treatment (96 hrs). Values are expressed as fold mean ± SD (*P < 0.05; n = 3).
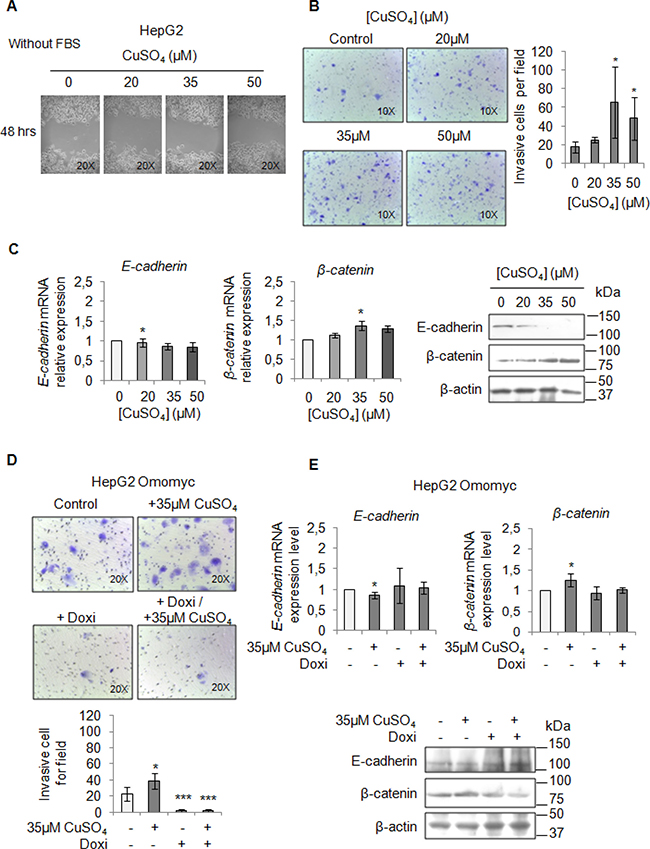
Figure 8: Copper induces HepG2 migration by MYC. (A) Analysis of cell migration by a wound-healing assay in Control and CuSO4 treated HepG2 cells. Representative microphotographs taken at 48 hrs post-wound (×20). (B) Transwell migration assay in HepG2 cells treated with copper for 48 hrs in serum free medium. Left: Representative microphotographs of crystal violet stained cells attached to the bottom membrane of a transwell (×20). Right: Quantification of the number of migratory cells, that were counted in five non-overlapping random fields of the membrane. Values are expressed as fold mean ± SD. (*P < 0.05; n = 3). (C) Relative mRNA expression (Left) and representative western blots (Right) of E-cadherin and β-catenin in HepG2 treated with CuSO4 for 96 hrs. Values are expressed as fold mean ± SD. (*P < 0.05; n = 3). (D) Transwell migration assay in HepG2 Omomyc cells in a serum-supplemented medium, after induction of Omomyc by doxycyclin (Doxi), before and after treatment with 35 μM CuSO4 (48 hrs). Top: Representative microphotographs of crystal violet stained cells attached to the bottom membrane of a transwell (×20). Bottom: Quantification of the number of migratory cells, that were counted in five non-overlapping random fields of the membrane. Values are expressed as fold mean ± SD. (*P < 0.05 and ***P < 0.001; n = 3). (E) Relative mRNA expression (Top) and representative western blots (Bottom) of E-cadherin and β-catenin in HepG2 Omomyc inducing cells in presence or not of copper treatment for 96 hrs. Values are expressed as fold mean ± SD (*P < 0.05; n = 3).
CTR1 silencing counteracts copper related pro-tumorigenic effects
To better understand the involvement of CTR1 in copper/MYC axis we transfected HepaRG and HepG2 cells with a pool of CTR1 siRNAs (siCTR1). As shown in Figure 9 siCTR1 specifically inhibited CTR1 expression, in presence or absence of 35 μM CuSO4. Copper transporter 2 protein, CTR2, was used as control.
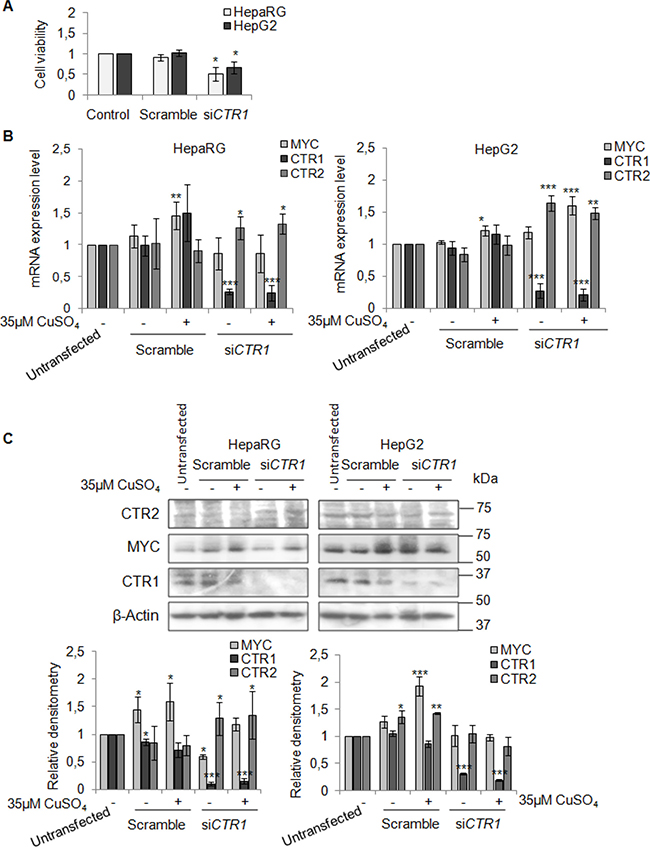
Figure 9: CTR1 silencing. (A) Relative cell viability evaluated by MTS assay. Results derived from three independent experiments and are represented as mean ± SD, respect to un-transfected cells. (B) Relative mRNA expression of MYC, CTR1 and CTR2 in scramble and siCTR1 transfected cells, in presence or absence of copper treatment (35 μM CuSO4). Values are expressed as mean ± SD (*P < 0.05, **P < 0.01, and ***P < 0.001, respect to un-transfected cells; n = 3). (C) Representative western blot (Top) and the relative densitomentric analysis (Bottom) of MYC, CTR1 and CTR2. Values are expressed as mean ± SD (*P < 0.05, **P < 0.01, and ***P < 0.001, respect to un-transfected cells; n = 3).
In HepaRG cells, CTR1 inhibition caused MYC protein down-regulation, without affecting its transcription. In these cells, MYC expression was restored by copper. On the other hand, siCTR1 didn’t seem to affect MYC protein expression in HepG2, in presence or absence of copper (Figure 9B and 9C). Flow cytometry analysis demonstrated that siCTR1, induced a significant decrease of percentage of cells in S phase and an increase in G2/M phase, in both cell lines. This phenomenon was more evident in HepaRG cells (Figure 10A).
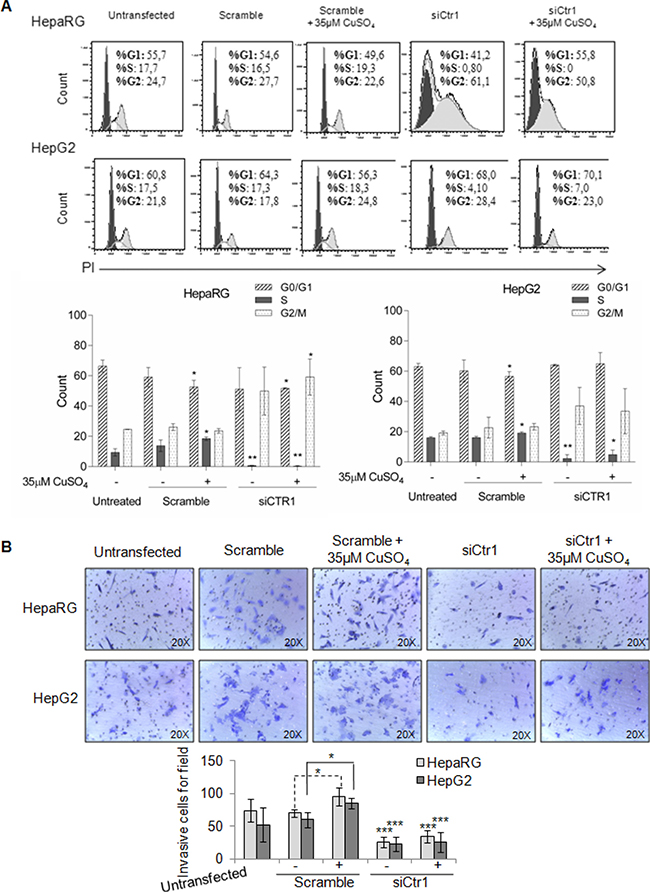
Figure 10: Biological effects of siCTR1. (A) Top: Representative cell cycle distribution of un-trasfected, transfected, scramble and siCTR1 cells, in presence or not of 35 μM CuSO4 treatment. Cell cycle was done by Propidium Iodide (PI) staining and flow cytometry analysis. Bottom: Histograms reported the values as mean ± SD (*P < 0.05; **P < 0.01, respect to untreated cells; n = 3). (B) Transwell migration assay of HepaRG and HepG2 cells performed after 48 hrs in un-trasfected, transfected, scramble and siCTR1 cells, with or without CuSO4 treatment. Top: Representative microphotographs of crystal violet stained cells migrated to the bottom membrane of transwell (×20). Bottom: Quantification of the number of migratory cells, counted in 5 non-overlapping random fields of the membrane. Values are expressed as fold mean ± SD. (*P < 0.05 and **P < 0.01; n = 3).
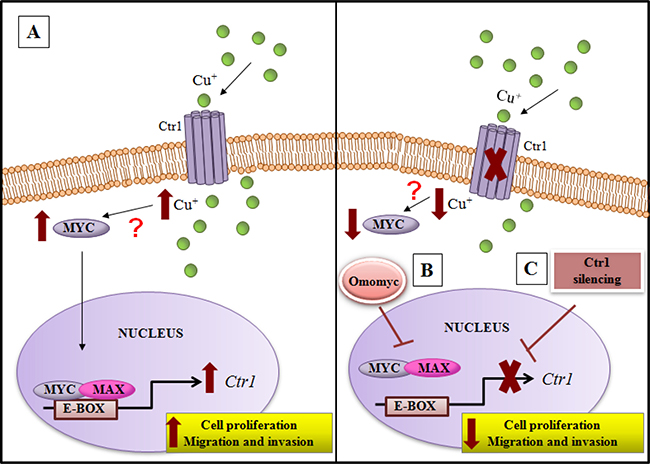
Figure 11: Model of copper/MYC/CTR1 axis in liver cells. (A) Higher levels of extracellular copper increase MYC expression that in turn by a direct interaction with the CTR1 promoter induces its transcription. The biological effect of MYC/CTR1 interplay promotes cell proliferation and invasiveness by the increased copper intracellular concentration. (B) Conversely, Omomyc, a dominant negative of MYC, impairing the bind of MYC/MAX complex to DNA on the CTR1 promoter, is able to counteract the copper-dependent effects, (C) as well as CTR1 silencing.
On the other hand, siCTR1 strongly counteracted copper-dependent invasiveness, in both cell lines (Figure 10B).
DISCUSSION
Beside genetic diseases (e.g. Wilson disease), high levels of copper serum concentration have been shown to correlate with tumor incidence, malignant progression, and recurrence of human cancers, including HCC. Our data indicate that increased circulating Cu significantly correlate with progression of NAFLD-cirrhosis toward -HCC (Figure 1A), suggesting that, as supported by the ROC curve analysis (sensitivity 65% and specificity 88.89%) (Figure 1B), copper might be a new biomarker of hepatocyte transformation. We identified a copper cut off value (163.3 μg/dl) to discriminate NAFLD cirrhotic patients prone to progress toward HCC (Figure 1B). Similar results (data not shown) were obtained in HCV-cirrhotic and -HCC patients, supporting the idea that high serum copper concentration seems to well correlate with the progression of liver cirrhosis to HCC, regardless its etiology. However, to consider copper as a warning for clinicians who follow NAFLD-cirrhotic patients, a longitudinal prospective multicenter clinical trial, devoted to answer if copper could be considered a biomarker of liver cell transformation and/or progression, should be developed.
Our clinical observations pushed us to investigate on the pathogenic involvement of copper in liver tumorigenesis. Copper treatment of HepaRG and HepG2 cells was able to induce their proliferation (Figure 2), migration and invasion (Figure 7 and Figure 8). These effects were associated with the up-regulation of PCNA and Cyclin D1, and with a down-regulation of E-cadherin together with an up-regulation of β-catenin expression levels. These data indicate that high copper concentrations in cell microenvironment have a main role in promoting both the onset and progression of liver tumor.
We highlighted, for the first time, that an interplay between copper and MYC exists, underscoring the ability of copper in inducing MYC expression (Figure 3B). Moreover, we demonstrated that MYC binds a specific consensus region on CTR1 promoter (Figure 3C), the principal copper transporter protein. Exploiting the anti-proliferative and anti-invasive efficacy of Omomyc (Figures 6, 7 and 8), a MYC dominant negative that inhibits the MYC/MAX interaction, we highlighted that MYC/MAX dimer is necessary for the transcription of CTR1, influencing, in this way, intracellular copper levels (Figure 5A and 5B). A schematic regulatory model of copper/MYC/CTR1 axis was proposed in Figure 11.
The addition of exogenous copper induced an increase of CTR1 transcription in HepaRG cells, but not in HepG2 cells (Figure 4B). This fact is maybe due to the high basal levels of copper in HepG2 cells (Figure 4A). Unexpectedly, CTR1 protein was down-regulated in both cell lines after Cu stimulation, suggesting that, when high extracellular Cu raises, cells activate a safeguard mechanism by a rapid internalization and/or degradation of CTR1 [6, 26]. In fact, accordingly with our data (Figure 4A and 4B), it has been recently reported that, in in vitro model, CTR1 expression, under high Cu conditions, is down-regulated [27].
Moreover, the CTR1 silencing caused, in HepaRG, a down-regulation of MYC expression, but after copper stimulation was able to restore its expression. No regulation of MYC protein was appreciated in HepG2 cells (Figure 9B and 9C).
Interestingly, our work highlights the differences existing between HepG2 and HepaRG cells. In fact, it seems that HepG2 cells lose the physiological regulation of copper/MYC/CTR1 axis, at least as regards its specific role in regulation of MYC expression. However, these differences are not surprising, in fact, HepaRG cells have been developed to tackle the problem of low metabolic profiles observed in HepG2 cells. Indeed, HepaRG cells retain a drug metabolism capacity comparable to that of primary hepatocytes with a functional stability as well as primary cells [28]. HepaRG, but not HepG2 cells, maintain hepatic functions and expression of liver-specific genes at comparable levels to hepatocytes [29]. Moreover, copper is implicated in handling and utilizing proteins involved in the striking metabolic changes that occur in cancer cells. Copper, in fact, has an essential role in cytochrome oxidase function, thus our results indicate that it would be interesting to ascertain if the expression of proteins that function in copper cellular influx might play a role in the Warburg effect.
Omomyc, a MYC interfering molecule, was partially able to revert the copper-related pro-proliferative effects (Figure 6), while it completely counteracted the copper-dependent invasiveness (Figure 7D and 7E, Figure 8D and 8E). This behavior could be due to the ability of copper in partially restoring the expression of MYC, despite the presence of Omomyc (Figure 5B) or to the participation of other important intracellular pathways that might counterbalance the suppression of MYC.
Finally, the immunohistochemical analysis for CTR1 and MYC proteins performed in normal, NAFLD-cirrhotic and -HCC tissues (Figure 4C), show a progressively increase of both CTR1 and MYC protein expression from normal toward HCC tissues. In line with these observations, the less differentiated HepG2 cells showed, at the baseline, higher CTR1 mRNA and protein levels respect to HepaRG cells (Figure 4A and B).
Our results are consistent with several recent findings on the importance of the microenvironment in defining tumor promotion and aggressiveness [30, 31]. However, the regulatory feedback involved in the control of the copper/MYC/CTR1 axis should be deeply analyzed by further studies.
The Cu/MYC/CTR1 interplay could pave the way to new approaches in refining HCC diagnosis and in planning new combined therapies. In this view, the reduction of the bioavailability of copper through copper chelation therapies could be of support to the standard chemotherapy, counteracting the CTR1/MYC dangerous connection.
MATERIALS AND METHODS
Patients and laboratory parameters
The study was performed on 20 control healthy subjects (HD), 20 NAFLD-cirrhotic and 9 NAFLD-HCC patients enrolled in accordance with the ethical guidelines of the 1975 Declaration of Helsinki and approved by Ethical Committee of the Sapienza University, Rome, Italy (N. 2534) and by the other involved Institutions. Informed consent was obtained from all patients.
The diagnosis of NAFLD-cirrhosis and NAFLD-HCC was based on exclusion of other common causes of cirrhosis and liver disease (viral hepatitis, alcoholic consumption >20 g/day for men and >10 g/day for woman, Wilson’s disease, autoimmune, alpha-1-antitrypsin deficiency and drug-induced liver disease). The diagnosis of NAFLD was based on the presence of steatosis by ultrasonography, plus at least one criterion of metabolic syndrome or history of type 2 diabetes.
The diagnosis of HCC was based on the EASL-EORTC Clinical Practice Guidelines [32]. Matched control subjects, aged between 18–40 years, did not shown any evidence of fatty liver at ultrasound. Clinical and anthropometric data were collected at the time of enrolment (Table 1).
Immunohistochemistry
Formalin-fixed, paraffin embedded sections (4 μm thick) were mounted. For antigen retrieval to detect c-MYC protein, deparaffinized and rehydrated sections were boiled in TRIS-EDTA buffer solution (pH 9) for 20 minutes. For CTR1 protein, deparaffinized and rehydrated sections were microwave-treated in 0.01 M citric acid buffer (pH 6.0), 2 cycles for 5 minutes each at 750 W. The slides were cooled and endogenous peroxidase were blocked with peroxidase block buffer (citric acid 0.04 M, Na2HPO4x2H2O 0.12 M, NaN3 0.03 M and H2O2 at 1.5% v/v) for 10 minutes at room temperature. Then, the sections were incubated for 1 hrs at room temperature with mouse monoclonal antibody anti-c-MYC (clone 9E10; 1:100 diluition, Santa Cruz, Milan) or with rabbit policlonal antibody anti-CTR1 (1:100 diluition, MyBioSource, Milan).
The primary antibodies were visualized using the avidin-biotin-peroxidase complex method (UltraTek HRP Anti-polyvalent, ScyTek, Logan, UT) according to the instruction manual. 3,3′diaminobenzidine was used as the enzyme substrate to observe the specific antibody localization, and Mayer hematoxylin was used as a nuclear counterstain. The score for IHC intensity was scaled as 0 for no IHC signal, 1 for weak, 2 for moderate, and 3 for strong IHC signals. The final score used in the analysis was calculated as already reported [31].
Cell cultures and treatments
HepaRG cells, a new human hepatoma cell line derived from a human hepatocellular carcinoma, were purchased from Thermo Fisher Scientific (HPRGC10, USA) that provided certificated authentication. These cells hold most hepatic functions, including a considerable expression of uptake transporter proteins in contrast to other hepatic immortalized cell lines [33]. HepaRG cells were maintained in William’s E medium with GlutaMAX supplemented with 10% fetal bovine serum (FBS), 100 U/ml penicillin, 100 μg/ml streptomycin, 5 μg/ml insulin (Sigma-Aldrich) and 5 × 10⁻⁵ M hydrocortisone hemisuccinate (Sigma-Aldrich). HepG2 were purchased from ATCC (HB-8065). These cells derive from the liver tissue of a 15 year old Caucasian American male with a well differentiated hepatocellular carcinoma, and were grown in Dulbecco’s Modified Eagle’s Medium (DMEM) supplemented with 10% FBS, 1% L-glutamine, 100 U/ml penicillin and 100 μg/ml streptomycin.
All the reagents were purchased from Thermo Fisher Scientific (USA), except as otherwise specified. All cell lines were cultured at 37°C in 5% CO2 in a 95% humidified atmosphere and tested for the presence of Mycoplasma. CuSO4 (Sigma) has been dissolved in the respective cell culture medium. To induce Omomyc expression 0.25 μg/ml of doxycycline (Doxi) (SIGMA) were used.
Evaluation of copper content
Cells in hypotonic PBS were lysate by sonication (for 20 s) and then diluted 1:2 (v:v) with 65% nitric acid (ApplicChemPanreac), while serum samples of HD and patients were directly diluted with nitric acid.
After one week of normocaloric diet, all serum samples were collected early in the morning (between 7am and 8am) in fasted subjects.
After copper dosage, sera were frozen immediately at –25°C for few days.
Copper content was assayed by atomic absorption spectroscopy using an AAnalyst 300 instrument equipped with a graphite furnace with platform (HGA800) and an AS-72 autosampler (Perkin-Elmer, Waltham, MA, USA). The results of intracellular copper content obtained (ng Cu) were normalized respect to protein concentration (ng of protein).
Cell viability assay
Control and CuSO4 treated cells were plated in a 96-well microplate and allowed to grow. At the end of copper treatment, the supernatant was aspirated and 100 μL medium mixed with MTS reagent (Promega, WI, USA) were added to each well, according to the manufacturer’s protocol. Wells only containing 200 μl medium were used as blanks and were subtracted as background from each sample. Results obtained in treated cells were expressed as relative respect to untreated cells.
Viral vectors and infections of Omomyc
The lentiviral plasmid pSLIK-FO harboring a Doxi inducible FlagOmomyc construct was already described [34, 35]. Briefly, Omomyc is an inducible negative dominant interfering MYC bHLHZip dimerization domain. Omomyc has four designed amino acid substitutions that facilitate homodimerization with all three oncogenic MYC proteins (c-Myc, N-Myc and L-Myc) blocking Myc-dependent transcriptional activation. Lentivirus vectors were prepared by co-transfecting HEK293T cells with pSLIK-FO and packaging plasmids PLP1, PLP2 and pMD VSV-G, as described [34, 35]. Viral particles were purified by centrifugation and used for infection in the presence of 4 μg/ml polybrene. Cells infected with Omomyc (HepaRG Omomyc and HepG2 Omomyc) were selected with 50–200 μg/ml hygromycin B (Sigma).
CTR1 silencing
HepaRG and HepG2 cells were plated, the day before transfection, at 70% confluence. The day after, the culture medium was re-freshed 30 minutes before transfection. 5 pmoles of siCTR1 (Accell SMARTpool, Dharmacon) and scrambled control vector were transfected by using Lipofectamine 2000 reagent (Thermo Fisher Scientific) according to the manufacturer’s instructions. After 72 hrs, MYC, CTR1 and CTR2 mRNA and protein levels were evaluated by Real-Time PCR and Western blotting, respectively.
RNA extraction and real-time polymerase chain reaction (RT-PCR) analysis
Total RNA extraction was performed using Trizol (Invitrogen) according to the manufacturer’s protocol and 1 μg was reverse transcribed using High-Capacity cDNA Reverse Transcription Kit (Thermo Fisher Scientific, USA) according to the manufacturer’s protocol. Real-Time (RT-PCR) amplification, detection and analysis were performed by 7500 Fast Real-Time PCR System (7500 Software v2.0.5, Applied Biosystems) using Power SYBR™ Green PCR Master Mix (Thermo Fisher Scientific, USA). The results were normalized to the β-actin levels. Relative expression was calculated using the comparative cycle threshold (Ct) method (2−ΔCt, ΔCt = Ct (target gene) - Ct (β-actin)). Data are expressed as fold induction (treated vs untreated) of 2−ΔCt mean ± standard deviation. The following PCR primers were designed by IDT Integrated DNA Technologies and purchased from BIO-FAB research (Rome, Italy): β-actin, 5′-GCACTCTTCCAGCCTTCC-3′ and 5′-AGGTCTTTGCGGATGTCCAC-3′; PCNA, 5′-TTTCC TGTGCAAAAGACGGA-3′ and 5′-CGTTGAAGAGAGT GGAGTGG-3′; Cyclin D1, 5′-ACAAGCTCAAGTGGAA CCTG-3′ and 5′-GAGGGCGGATTGGAAATGAA-3′; MYC, 5′-CTCCACACATCAGCACAACT-3′ and 5′-GCC TCTTGACATTCTCCTCG-3′; CTR1 5′-CGTAAGTCACA AGTCAGC-3′ and 5′-AGGTACCCGTTGTAGGTC-3′; CTR2 5′-CTAGCTTACCCACTTCTC-3′ and 5′-TGG GAATAAGGTGGAGGA-3′, β-Catenin, 5′-GCAAGC TCATCATACTGGCT-3′ and 5′-GCATTCCACCAGCT TCTACA-3′; E-Cadherin 5′-AGGATCTTGGCTG AGGAT-3′ and 5′-AAGGGGTCTGTCATGGAA-3′.
Immunoblot analysis
Total protein extraction was performed by homogenizing cells in Ripa lysis buffer containing 1X protease and phosphatase inhibitors cocktail (Thermo Fisher). The homogenates, after 30 min of incubation on ice, were then centrifuged at 13,000 rpm for 30 min at 4°C. The supernatant was then quantified using the Bradford Protein Assay (Bio-Rad, Inc),analysed in denaturing conditions through SDS-PAGE and then transferred and immobilized onto nitrocellulose membranes (Amersham). The membranes were blocked using 5% non-fat dry milk (PanReacApplichem) for 30 min and incubated with the appropriate primary and secondary antibodies. Primary antibodies were the following: β-actin (sc-47778, C4), Cyclin D1 (sc-8396, A-12), MYC (sc-40, 9E10), E-cadherin (sc-8426, G-10), CTR1 (sc-66847, FL-190) all purchased from Santa Cruz Biotechnology; β-catenin (BDBiosciences, 610154, 14/Beta-Catenin), CTR2 (PA5-22961, Thermo Fisher), PCNA (Abcam, Ab 29, PC10) and Flag (Sigma, F3165, M2). Antibody detection was performed by Amersham ECL and Hyperfilm (GE Healthcare Life Sciences). Densitometric analysis of immunoblots was performed by ImageJ64 image processing software for electrophoresis gel analysis.
Cell cycle analysis
Cells were harvested through trypsinization, washed twice with cold PBS, and subsequently fixed in 70% ethanol at 4°C overnight. After fixation, the cells were washed with PBS and permeabilized with 0.25% Triton X-100 in PBS for 15 min in ice. After washing in cold PBS, cells were incubated in a solution containing 10 mg/mL of RNase and 1 mg/mL of propidium iodide (Sigma-Aldrich, USA) at room temperature for 30 min in the dark. The DNA content was determined using flow cytometry (FACSCanto™ II, BD Biosciences, USA). The percentage of the cells in the G0/G1, S and G2/M phases was determined using FlowJo V10.08 software (Tree Star, Ashland, OR).
Apoptosis assay by Annexin V-FITC and PI staining
Annexin V Fluorescein (FITC) and Propidium Iodide (PI) double staining assay (Annexin V-FITC Apoptosis detection Kit, eBioscience™) was performed to quantify apoptosis using flow cytometry (FACSCanto™ II, BD Biosciences, USA). Data wereanalyzed using FlowJo V10.08 software (Tree Star Inc., Ashland OR). Analysis allowed discrimination among live (Annexin V-/PI-), necrotic cells (Annexin V-/PI+), late apoptotic (Annexin V+/PI+) and early apoptotic (Annexin V+/PI-).
Wound-healing migration assay
Cells were plated, in serum free medium, at a density of 100.000 cells on 24-wells plate. The following day, a wound was made with a pipette tip to create a scratch on the monolayer and the serum free medium was changed with medium containing CuSO4. Photomicrographs with phase contrast microscope were taken after 48 hrs of treatment.
Invasion assay
Cells were plated at a density of 40000 cells in the upper compartment of a cell invasion insert (Cultrex Coat BME, Trevigen). The migrated cells into the lower compartment were stained with Crystal Violet (1% Crystal Violet powder in 35% ethanol, w/v) for 10 min and were counted the number of migrated cells in five random fields within the insert. Cells were photographed under an inverted phase-contrast microscope after 48 hrs.
Chromatin immunoprecipitation (ChIP) assay
Samples for ChIP assays were prepared and analyzed according to MAGnify Chromatin Immunoprecipitation System protocol (Thermo Fischer Scientific, USA). Samples were immunoprecipitated overnight at 4°C with MYC specific antibody 9E10-X, Santa Cruz Biotech, and the promoter region of interest was amplified by RT-PCR. The PCR primers (Thermo Fisher Scientific, USA) designed to amplify the MYC consensus sequence within CTR1 promoter were: Forward 5′-AGCACAT GGCTGTCATTACC-3′ and Reverse 5′-ATGCAACAATC AGTCCAAGC-3′. Relative enrichment was calculated as 2ΔCt(x) - 2ΔCt(b), where ΔCt value was calculated by subtracting the Ct value of the immunoprecipitated sample (x) from the Ct value of the input and the same was calculated for control IgG sample (background (b)).
Statistical analysis
Results were expressed as mean ± standard deviation (SD). All in vitro experiments were performed in triplicate. A 2-tailed paired/unpaired Student t test was used to analyze in vitro data. The 2-tailed Mann-Whitney test was applied to compare groups of ex vivo samples. Statistical significance was assessed by p-value (P) thresholds: *P < 0.05; **P < 0.01; ***P < 0.001. We tested the accuracy of serum Cu concentration for detecting NAFLD-associated HCC by the area under the receiver operating characteristic curve by ROC analysis. The threshold index was identified by ROC analysis, and its sensitivity, specificity and likelihood ratios were calculated. All statistical analyses were performed with Prism software version 6 (GraphPad Software, San Diego, CA).
Author contributions
Study concept and design: C. Balsano, C. Porcu, L. Antonucci; Development of methodology: C. Porcu, L. Antonucci, B. Barbaro; Analysis and interpretation of data: C. Balsano, C. Porcu, L. Antonucci; Drafting of the manuscript: C. Balsano, C. Porcu, L. Antonucci, B. Barbaro; Critical revision of the manuscript for important intellectual content: S. Nasi, B. Illi; Immunoistochemical analysis: M. Martini; Providing of serum samples: L. Miele, A. Grieco, A. Licata; Statistical analysis: C. Porcu, L. Antonucci; Fundraising: C. Balsano.
ACKNOWLEDGMENTS AND FUNDING
FIRB RBAP10MY35, Gilead Fellowship Program 2014 Edition and F. Balsano Foundation grant 2016. We thanks A. Cocomazzi for her technical support for the immunohistochemical analysis.
CONFLICTS OF INTEREST
The authors declare that they have no conflicts of interest.
REFERENCES
1. Hordyjewska A, Popiołek Ł, Kocot J. ‘The many “‘faces’” of copper in medicine and treatment. BioMetals 2014; 27:611–621. https://doi.org/10.1007/s10534-014-9736-5.
2. Lowe J, Taveira-da-Silva R, Hilário-Souza E. Dissecting copper homeostasis in diabetes mellitus. IUBMB Life 2017; 69:255–262. https://doi.org/10.1002/iub.1614.
3. Morrell A, Tallino S, Yu L, Burkhead JL. The role of insufficient copper in lipid synthesis and fatty-liver disease. IUBMB Life 2017; 69:263–270. https://doi.org/10.1002/iub.1613.
4. Wachsmann J, Peng F. Molecular imaging and therapy targeting copper metabolism in hepatocellular carcinoma. World Journal of Gastroenterology 2016; 22:221–31. https://doi.org/10.3748/wjg.v22.i1.221.
5. Wee NK, Weinstein DC, Fraser ST, Assinder SJ. The mammalian copper transporters CTR1 and CTR2 and their roles in development and disease. Int J Biochem Cell Biol. 2013; 45:960–3. https://doi.org/10.1016/j.biocel.2013.01.018.
6. Ohrvik H, Thiele DJ. How copper traverses cellular membranes through the mammalian copper transporter 1, Ctr1. Ann N Y Acad Sci. 2014;1314:32-41. https://doi.org/10.1111/nyas.12371.
7. Malmström BG, Leckner J. The chemical biology of copper. Current Opinion in Chemical Biology. 1998; 2:286–292. https://doi.org/10.1016/S1367-5931(98)80071-9.
8. Gaetke LM, Chow-Johnson HS, Chow CK. Copper: toxicological relevance and mechanisms. Archives of Toxicology. 2014; 88:1929–1938. https://doi.org/10.1007/s00204-014-1355-y.
9. Halliwell B, Gutteridge JMC. Oxygen toxicity, oxygen radicals, transition metals and disease. Biochemical Journal. 1984; 219:1–14.
10. Sun S, Cai J, Yang Q, Zhao S, Wang Z. The association between copper transporters and the prognosis of cancer patients undergoing chemotherapy: a meta-analysis of literatures and datasets. Oncotarget. 2017; 8:16036–16051. https://doi.org/10.18632/oncotarget.13917.
11. Himoto T, Fujita K, Nomura T, Tani J, Miyoshi H, Morishita A, Yoneyama H, Kubota S, Haba R, Suzuki Y, Masaki T. Roles of Copper in Hepatocarcinogenesis via the Activation of Hypoxia-Inducible Factor-1α. Biol Trace Elem Res. 2016; 174:58–64. https://doi.org/10.1007/s12011-016-0702-7.
12. Geetha A, Saranya P, Annie Jeyachristy S, Surendran R, Sundaram A. Relevance of non-ceruloplasmin copper to oxidative stress in patients with hepatocellular carcinoma. Biol Trace Elem Res. 2009; 130:229–40. https://doi.org/10.1007/s12011-009-8338-5.
13. Wong CR, Nguyen MH, Lim JK. Hepatocellular carcinoma in patients with non-alcoholic fatty liver disease. World J Gastroenterol. 2016; 22:8294–8303. https://doi.org/10.3748/wjg.v22.i37.8294.
14. Aigner E, Weiss G, Datz C. Dysregulation of iron and copper homeostasis in nonalcoholic fatty liver. World J Hepatol. 2015; 7:177–188. https://doi.org/10.4254/wjh.v7.i2.177.
15. Bruix J, Gores GJ, Mazzaferro V. Hepatocellular carcinoma: clinical frontiers and perspectives. Gut. 2014; 63:844–855. https://doi.org/10.1136/gutjnl-2013-306627.
16. Llovet JM, Hernandez-Ge V. Hepatocellular carcinoma: reasons for phase III failure and novel perspectives on trial design. Clin. Cancer Res. 2014; 20:2072–2079. https://doi.org/10.1158/1078-0432.
17. Mir N, Jayachandran A, Dhungel B, Shrestha R, Steel JC. Epithelial-to-Mesenchymal Transition: a Mediator of Sorafenib Resistance in Advanced Hepatocellular Carcinoma. Curr Cancer Drug Targets. 2017; 17:698–706. https://doi.org/10.2174/1568009617666170427104356.
18. Giannelli G, Koudelkova P, Dituri F, Mikulits W. Role of epithelial to mesenchymal transition in hepatocellular carcinoma. J Hepatol. 2016; 65:798–808. https://doi.org/10.1016/j.jhep.2016.05.007.
19. Jeanes A, Gottardi CJ, Yap AS. Cadherins and cancer: how does cadherin dysfunction promote tumor progression? Oncogene. 2008; 27:6920–9. https://doi.org/10.1038/onc.2008.343.
20. Cho KB, Cho MK, Lee WY, Kang KW. Overexpression of c-myc induces epithelial mesenchymal transition in mammary epithelial cells. Cancer Lett. 2010; 293:230–9. https://doi.org/10.1016/j.canlet.2010.01.013.
21. Shi JW, Liu W, Zhang TT, Wang SC, Lin XL, Li J, Jia JS, Sheng HF, Yao ZF, Zhao WT, Zhao ZL, Xie RY, Yang S, et al. The enforced expression of c-Myc in pig fibroblasts triggers mesenchymal epithelial transition (MET) via F-actin reorganization and RhoA/Rock pathway inactivation. Cell Cycle. 2013; 12:1119–27. https://doi.org/10.4161/cc.24164.
22. Soucek L, Helmer-Citterich M, Sacco A, Jucker R, Cesareni G, Nasi S. Design and properties of a Myc derivative that efficiently homodimerizes. Oncogene. 1998; 17:2463–72. https://doi.org/v10.1038/sj.onc.1202199.
23. Soucek L, Whitfield J, Martins CP, Finch AJ, Murphy DJ, Sodir NM, Karnezis AN, Swigart LB, Nasi S, Evan GI. Modeling Myc inhibition as cancer therapy. Nature. 2008; 455:679–683. https://doi.org/10.1038/nature07260.
24. Stine ZE, Walton ZE, Altman BJ, Hsieh AL, Dang CV. MYC, Metabolism, and Cancer. Cancer Discov. 2015; 5:1024–1039. https://doi.org/10.1158/2159-8290.CD-15-0507.
25. Dolezal JM, Wang H, Kulkarni S, Jackson L, Lu J, Ranganathan S, Goetzman ES, Bharathi SS, Beezhold K, Byersdorfer CA, Prochownik EV. Sequential adaptive changes in a c-Myc-driven model of hepatocellular carcinoma. J.Biol.Chem. 2017; 292:10068–10086. https://doi.org/10.1074/jbc.M117.782052.
26. Molloy SA, Kaplan JH. Copper-dependent recycling of hCTR1, the human high affinity copper transporter. J Biol Chem. 2009; 284:29704–29713.
27. Chun H, Catterton T, Kim H, Lee J, Kim BE. Organ-specific regulation of ATP7A abundance is coordinated with systemic copper homeostasis. Sci Rep. 2017; 7:12001. https://doi.org/10.1038/s41598-017-11961-z.
28. Lambert C, Spire C, Claude N, Guillouzo A. Dose- and time-dependant effects of phenobarbital on gene expression profiling in human hepatoma HepaRG cells. Toxicol Appl Pharmacol. 2009; 234:345–360. https://doi.org/10.1016/j.taap.2008.11.008.
29. Anthérieu S, Chesné C, Li R, Camus S, Lahoz A, Picazo L, Turpeinen M, Tolonen A, Uusitalo J, Guguen-Guillouzo C, Guillouzo A. Stable expression, activity and inducibility of cytochromes P450 in differentiated HepaRG cells. Drug Met. Disp. 2010; 38:516–525. https://doi.org/10.1124/dmd.109.030197.
30. Quail DF, Joyce JA. Microenvironmental regulation of tumor progression and metastasis. Nat. Med. 2013; 19:1423–37. https://doi.org/10.1038/nm.3394.
31. Hanahan D, Coussens LM. Accessories to the Crime: Functions of Cells Recruited to the Tumor Microenvironment. Cancer Cell. 2012; 21:309–22. https://doi.org/10.1016/j.ccr.2012.02.022.
32. European Association For The Study Of The Liver; European Organization For Research And Treatment Of Cancer. EASL-EORTC clinical practice guidelines: management of hepatocellular carcinoma. J Hepatol. 2012; 56:908–43. https://doi.org/10.1016/j.jhep.2011.12.001.
33. Cenci T, Martini M, Montano N, D'Alessandris QG, Falchetti ML, Annibali D, Savino M, Bianchi F, Pierconti F, Nasi S, Pallini R, Larocca LM. Prognostic relevance of c-Myc and BMI1 expression in patients with glioblastoma. Am J Clin Pathol. 2012; 138:390–6. https://doi.org/10.1309/AJCPRXHNJQLO09QA.
34. Szabo M, Veres Z, Baranyai Z, Jakab F, Jemnitz K. Comparison of human hepatoma HepaRG cells with human and rat hepatocytes in uptake transport assays in order to predict a risk of drug induced hepatotoxicity. PLoS One. 2013; 8:e59432. https://doi.org/10.1371/journal.pone.0059432.
35. Galardi S, Savino M, Scagnoli F, Pellegatta S, Pisati F, Zambelli F, Illi B, Annibali D, Beji S, Orecchini E, Alberelli MA, Apicella C, Fontanella RA, et al. Resetting cancer stem cell regulatory nodes upon MYC inhibition. EMBO Rep. 2016; 17:1872–1889. https://doi.org/10.15252/embr.201541489.