
INTRODUCTION
Magnesium (Mg2+) has been implicated in numerous vital cellular processes [1, 2, 3]. Its deficiency can have detrimental effects on the life of the cell [1]. Intracellular Mg2+ deficiency (IMD) can be caused: (1) by an insufficient supply of the ion from the extracellular milieu; (2) by mutation, i.e., non-functional or faulty cellular Mg2+ transport systems; or (3) by disrupted mechanisms regulating the influx, deposition, reposition, and efflux of the ion from the cell [1]. Little is known about the regulation of intracellular magnesium homeostasis (IMH), largely because of the lack of knowledge about the identities of cellular Mg2+ transport mechanisms, most of which have been discovered only recently.
Solute carrier SLC41A1 (further referred to as A1) has been characterized as being a Na+/Mg2+ exchanger (NME) and the major cellular Mg2+ efflux system ubiquitously expressed in various cell types [4–7 and http://www.proteinatlas.org/ENSG00000133065-SLC41A1/tissue]. The increased activity of NME is associated with many maladies, e.g., hypertension, preeclampsia, neurodegenerative disorders, cystic fibrosis, and diabetes mellitus [6, 8–13]. Even though IMD is assumed to contribute to the clinical image of the aforementioned maladies, whether it is also one of the primary causes of these diseases remains uncertain.
The function of A1 is regulated by cAMP-dependent protein kinase A (PKA) [5–7]. The increased PKA-dependent phosphorylation of SLC41A1 leads to an increase of Mg2+ efflux capacity in transgenic HEK293 cells [5, 6]. Levels of intracellular cAMP are controlled by various hormonal stimuli [13]. In several reports, the authors have demonstrated either the inhibitory (e.g., insulin; INS) or stimulatory (e.g., angiotensin II; ANG) effects of hormones on NME performance [13–15]. In particular, the inhibitory effect of INS may play a protective role against the excessive loss of Mg2+ from cells. The INS signaling axis IRTK – PI3K – Akt/PKB with the end effector phosphodiesterase 3b (PDE3b) is assumed to regulate (decrease) the level of cAMP and consequently also of PKA-dependent SLC41A1 activation [13]. Many other extracellular signals might influence the activity of the PI3K-Akt/PKB signaling node. Among these are neuritin signaling via IRTK – PI3K – Akt/PKB; platelet-derived growth factor (PDGF) signaling via PDGFR – PI3K – Akt/PKB; epidermal growth factor (EGF) signaling via EGFR – PI3K – Akt/PKB; insulin-like growth factor 1 (IGF-1) signaling via IGF-1R – PI3K – Akt/PKB; leptin (L) signaling via the LR – JAK2 – IRS2 signaling switch; growth hormone (GH), interferon-gamma (INFγ), and leukemia inhibitory factor (LIF) signaling via the GHR/INFγR/LIFR – JAK2 – IRS1 signaling switch; and extracellular polyvalent-ligand-activating integrin-linked FAK/c-Src dual kinase - PI3K - Akt/PKB signaling (Figure 1) [16–23]. Therefore, a reasonable assumption is that the activity of SLC41A1 in various tissues is regulated by the interplay of various extracellular signals translated into the activity of the PI3K-Akt/PKB signaling node.
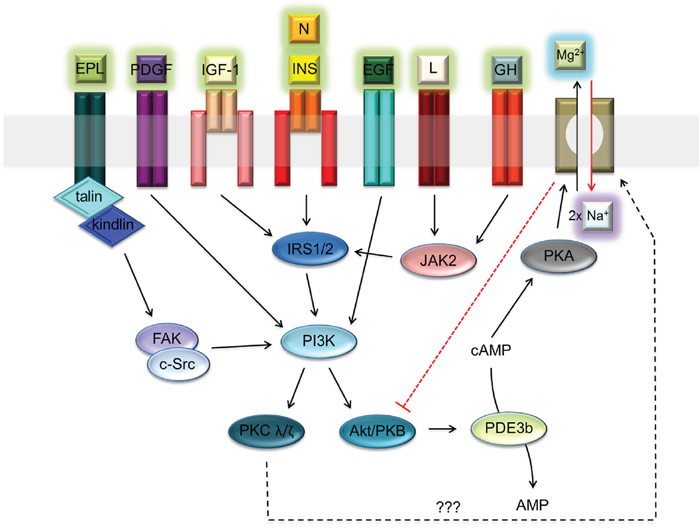
Figure 1: Receptor-ligand network activating PI3K – Akt/PKB signaling node. Abbreviations: Akt/PKB, protein kinase B; cAMP, cyclic adenosine monophosphate; c-Src, proto-oncogene tyrosine-protein kinase; EGF, epidermal growth factor; EPL, extracellular polyvalent ligands; FAK, focal adhesion kinase; GH, growth hormone; INS, insulin; IRS1/2, insulin receptor substrate 1 and 2; I, integrin; PDGF, platelet-derived growth factor; IGF-1, insulin-like growth factor 1; JAK2, Janus kinase 2; L, leptin; N, neuritin; PDE3b, phosphodiesterase 3b; PI3K, phosphatidylinositol-4,5-bisphosphate 3-kinase; PKA, protein kinase A; PKC λ/ζ, protein kinase C λ or ζ; R, receptor. Dashed black arrow indicates a speculative link between PKC and Na+/Mg2+ exchanger [65, 66]. Dashed red line indicates the inhibitory effect of SLC41A1 on Akt/PKB activity.
In our previous work, we have demonstrated that increased Mg2+ efflux capacity is achieved by the overexpression of A1 in HEK293 cells [4, 5]. The overexpression of A1 is also disease-related. Recently, this has been correlated with preeclampsia, a life-threatening condition in pregnant women [10]. Promotor and/or other regulatory sequences of A1 are assumed to possess androgen-responsive elements (AREs) that bind androgen receptor (AR) dimers [24, 25]. AR dimers then bind other transcription factors and regulate the transcription activity of the gene [11]. Apart from this, nothing is known about the regulation of A1 expression or about any impacts of A1 expression on the complex physiology of the cell.
Here, we have examined the effects of the A1 expression status on dynamic mass redistribution (DMR) signals reflecting an integrated physiological response of the cell to (1) SFLLR-NH2 stimulation and (2) the modulation of [Mg2+]e. Furthermore, we have examined the impact of A1 overexpression and of [Mg2+]e on the phosphorylation of receptor tyrosine kinases (RTK) and important cellular signaling nodes.
RESULTS
Overexpression of A1 modulates the DMR profile of HEK293 cells
The DMR signal is an integrated response that consists of contributions from many cellular events induced by the ligand, thus providing alternative means for studying cell systems biology [26]. To date, DMR signals have been prevalently studied with regard to three classes of receptors: EGFR, Gq-coupled receptors, and Gs-coupled receptors [26]. Here, we have tested the effect of SFLLR-NH2 in uninduced cells (further referred to as –tet cells) and tet-induced cells overexpressing A1 (further referred to as +tet cells). SFLLR-NH2 is an agonist of G-protein-coupled protease-activated receptor 1 (PAR-1) and, at higher concentrations, also of PAR-2, which is used as a positive DMR control in HEK293 cells (PerkinElmer) [27–29].
As shown in Figure 2A, the addition of SFLLR-NH2 (5 μM) to Ca2+- and Mg2+-free Hank’s balanced saline supplemented with 10 mM HEPES pH 7.4 (CMF-HBSS+; bath solution) induced a biphasic DMR signal in the –tet cells. The positive (increasing) DMR (P-DMR) signal was followed by a sequential negative (decay) signal (N-DMR). The peak amplitude of the DMR signal in the –tet cells reached 141 ± 13.7 pm (N = 15). The DMR signal amplitude at the end of the measurement (36 min after the application of SFLLR-NH2) reached 103 ± 16.7 pm (N = 15). In the +tet cells, the application of SFLLR-NH2 induced an N-DMR signal followed by a weak P-DMR sequence (Figure 2A). The peak amplitude of the DMR signal in the +tet cells reached -83.3 ± 17.5 pm, and the amplitude at the end of the measurement was -70.8 ± 24.8 pm (N = 15). Both the peak amplitude and the amplitude of the DMR signal at the end of the measurement in the +tet cells were significantly (both P < 0.001) different from those in the –tet cells.
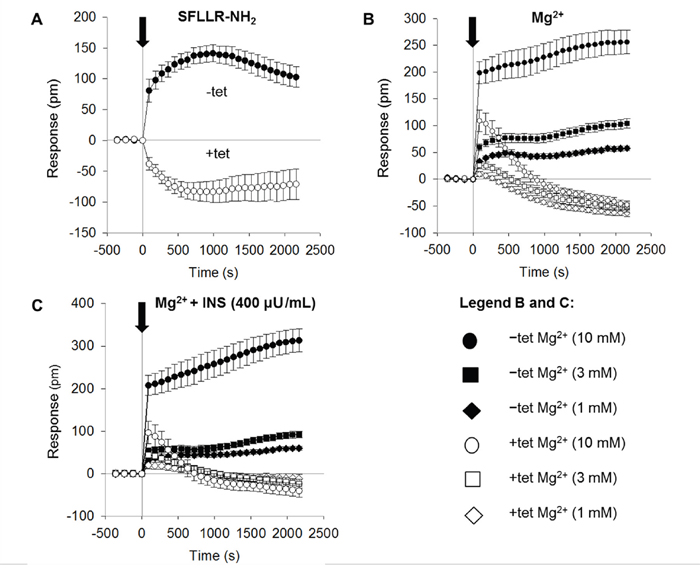
Figure 2: Real-time DMR signals measured in –tet and +tet HEK293 cells and induced by application of (A) SFLLR-NH2 (5 μM) or (B) Mg2+ at various concentrations (1, 3, or 10 mM). (C) Real-time DMR signals measured in –tet and +tet HEK293 cells and induced by application of Mg2+ at various concentrations (1, 3, or 10 mM) in the presence of INS (400 μU/mL) in the examined (CDF-HBSS+) solution. Black arrow indicates the application of SFLLR-NH2, of Mg2+, or of Mg2+ with INS (Time 0 s). Before application of the respective effectors, –tet and +tet cells were equilibrated in CMF-HBSS+ for 90 min (60 min equilibration plus 30 min baseline measurements). DMR signals are given as the response in picometers (pm). Data were acquired at 90 s intervals. Data are presented as means (N = 15 for each tested condition) ± SE. Abbreviations: DMR, dynamic mass redistribution; INS, insulin; SFLLR-NH2, protease-activated receptor 1 activating peptide; tet, tetracycline.
To our knowledge, DMR technology has not previously been used to monitor the effect of [Mg2+]e (or other extracellular ions) on the integrated cellular response. Moreover, increased [Mg2+]e and natural polyamines (spermine and spermidine) have been shown to activate IR without the presence of INS [30].
Therefore, we next tested whether the changing of [Mg2+]e influenced the DMR profile of the –tet and +tet cells. During the measurements, the cells were bathed in CMF-HBSS+ plus Mg2+. The addition of Mg2+ (1, 3 or 10 mM) induced dose-dependent DMR signals in both the –tet and +tet cells. However, the amplitude and overall profile of the DMR signals acquired in the –tet cells were markedly different from those in the +tet cells. Whereas the DMR signals in the –tet cells were clearly positive (P-DMR) at all three [Mg2+]e, the DMR signals in the +tet cells started as P-DMR signals and quickly reverted to decaying N-DMR signal sequences at all three [Mg2+]e (Figure 2B, Table 1).
Table 1: DMR signals presented as response in picometers (pm) and measured in –tet and +tet HEK293 cells at the maximum of P-DMR amplitude and at the time point of 36 min after application of the indicated [Mg2+]e, in the absence or presence of INS in the saline
INS (μU/mL) |
|
0 |
400 |
0 |
400 |
|---|---|---|---|---|---|
Tet (1 μg/mL/15 hrs) |
|
- |
- |
+ |
+ |
[Mg2+]e (mM) |
DMR (pm) |
|
|
|
|
1 |
P-DMRmax |
57.7 ± 4.38 |
59.8 ± 4.77 |
9.58 ± 4.72 |
19.9 ± 7.80 |
3 |
P-DMRmax |
104 ± 8.91 |
92.5 ± 7.97 |
25.9 ± 6.41 |
44.3 ± 7.94* |
10 |
P-DMRmax |
256 ± 22.2 |
314 ± 26.7 |
109 ± 20.3 |
96.8 ± 26.8 |
1 |
36 min |
57.7 ± 4.38 |
59.8 ± 4.77 |
-63.5 ± 5.85 |
-11.8 ± 10.2*** |
3 |
36 min |
104 ± 8.91 |
92.5 ± 7.97 |
-52.8 ± 8.13 |
-23.4 ± 10.3* |
10 |
36 min |
256 ± 22.2 |
314 ± 26.7 |
-47.7 ± 6.77 |
-40.1 ± 15.3 |
N = 15 for each tested condition. Significance of pairwise comparison INS 0 μU/mL vs. INS 400 μU/mL in both –tet and +tet cells at all tested [Mg2+]e: P* < 0.05, P*** < 0.001. Abbreviations: DMR, dynamic mass redistribution; INS, insulin; P-DMRmax, maximal amplitude of positive DMR; tet, tetracycline.
We subsequently tested whether INS (400 μU/mL) quantitatively and/or qualitatively changed the DMR signals seen in the –tet and +tet cells upon the addition of 1, 3, or 10 mM Mg2+ to the bath solution. As demonstrated in Figure 2C and Table 1, the simultaneous application of INS and Mg2+ had no pronounced effect on the quantitative and/or qualitative features of the [Mg2+]e-dependent DMR signals in the –tet cells. However, in the +tet cells, the simultaneous application of INS and 3 mM Mg2+ led to a significant (P < 0.05) increase of the peak amplitude of the P-DMR signal (Figure 2C, Table 1). The application of INS together with 1 or 3 mM Mg2+ led to a significant (P < 0.001 and P < 0.05, respectively) reduction of the amplitude of the N-DMR signal at the end of the measurement (time point 36 min; Figure 2C, Table 1). The simultaneous application of INS and 10 mM Mg2+ had no significant effect on the amplitude of the [Mg2+]e-dependent DMR signal at the time point 36 min in +tet cells (Figure 2C, Table 1).
All DMR measurements were accompanied by a cell confluence assessment by using in-well imaging before the application of the particular effector, immediately after measurements and at 1.5 hours after the end of measurements (Supplementary Figure 1). Figure 3 demonstrates that none of the interventions and measurements had any significant effect on cell confluence and viability.
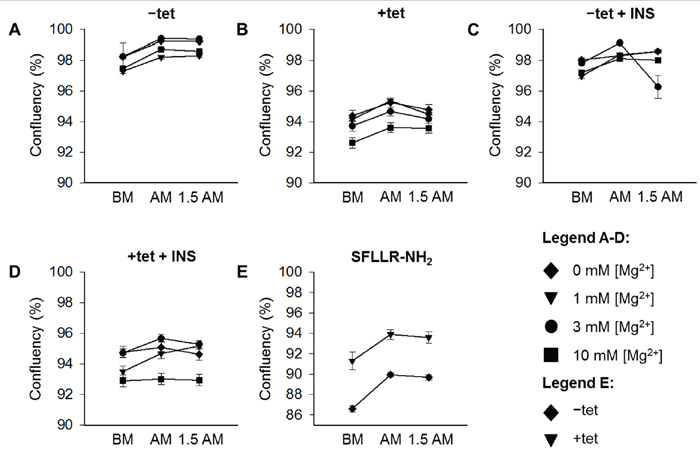
Figure 3: Cell confluence assessed by using in-well imaging before the application of the particular effector(s), immediately after measurements, and 1. 5 hour after the end of measurements. Measurements were performed with –tet (A, C, E) and with +tet HEK293 cells (B, D, E) without INS (A, B) or with INS (400 μU/mL; C, D) in CMF-HBSS+. [Mg2+]e are indicated. Data are presented as means (for A – D, N = 12 – 15; for E, N = 9) ± SE. Abbreviations: 1.5 AM, 1.5 hrs after measurement; AM, after measurement; BM, before measurement; INS, insulin; SFLLR-NH2, protease-activated receptor 1 activating peptide; tet, tetracycline.
Taken together, our data reveal that the overexpression of A1 changes conspicuously the SFLLR-NH2- or [Mg2+]e-specific DMR fingerprint of HEK293 cells, indicating a complex physiological difference between the –tet and +tet cells. Furthermore, INS has an effect on the [Mg2+]e-dependent DMR signal in the +tet cells at [Mg2+]e of 1 and 3 mM.
Overexpression of A1 and variation of [Mg2+]e modulate Akt/PKB signaling
As we had observed that both A1 overexpression and [Mg2+]e induce and/or modify the DMR signal, we next examined whether the overexpression of A1 and/or variation of [Mg2+]e influenced any of the 11 important signaling nodes included in the PathScan® RTK Signaling Antibody Array (PRSA). As shown in Figures 4 and 5A, prominent signals corresponding to phosphorylated Akt/PKB-Thr308, Akt/PKB-Ser473, S6RP-Ser235/236, Erk1/2-Thr202/Tyr204, and Src-Tyrpan were detected in the –tet and +tet cells, indicating that these kinases and their adjacent signaling cascades play an important role in the basal processes in these cells. Furthermore, the overexpression of A1 (15 hrs, condition 0 (C0)) significantly attenuated (by 49.1± 9%; P < 0.001) the phosphorylation of Akt/PKB-Ser473 in +tet cells when compared with –tet cells (Figures 4 and 5A). Moreover, the phosphorylation of Erk1/2-Thr202/Tyr204 was significantly attenuated (by 56.8 ± 7%; P < 0.05) in +tet cells when compared with –tet cells (Figures 4 and 5A). No statistical differences were detected between the levels of phosphorylation of Akt/PKB-Thr308, S6RP-Ser235/236, and Src-Tyrpan in –tet and +tet cells (Figure 5A).
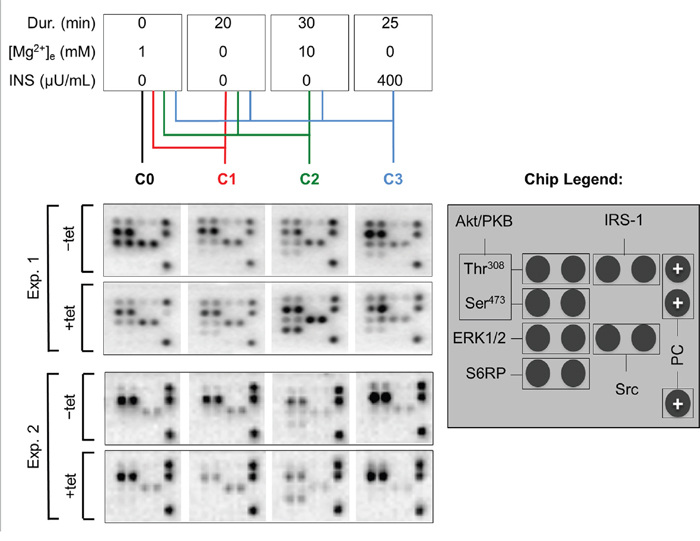
Figure 4: PathScan® RTK Signaling Antibody Arrays (PRSA) displaying phosphorylation of respective phospho-substrates in –tet (control) and +tet (SLC41A1-overexpressing) HEK293 cells treated with C0, C1, C2, or C3. Two examples out of six independent experimental series are shown. Abbreviations: Akt/PKB, protein kinase B; C, condition; Src, proto-oncogene tyrosine-protein kinase Src; Dur., duration; Erk1/2, extracellular signal-regulated kinase 1/2; INS, insulin; IRS-1, insulin receptor substrate 1; PC, positive control; S6RP, S6 ribosomal protein; tet, tetracycline.
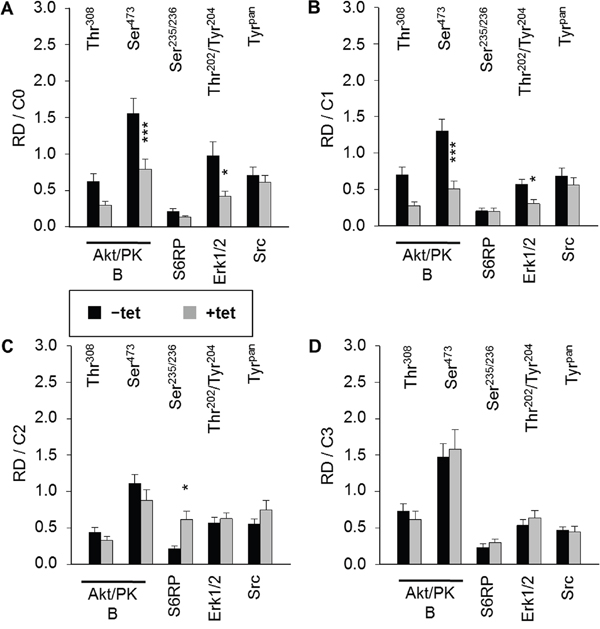
Figure 5: Pairwise comparison of averaged relative densities of particular phospho-signals (Akt/PKB-Thr308, Akt/PKB-Ser473, S6RP-Ser235/236, Erk1/2-Thr202/Tyr204, Src-Tyrpan) in –tet (control) and +tet (SLC41A1-overexpressing) HEK293 cells treated with (A) C0, (B) C1, (C) C2, or (D) C3, as obtained with PathScan® RTK Signaling Antibody Array (see Figure 4 for details). Each averaged density value results from six independent biological experiments (N/n = 6/12; respective phospho-signals were detected on chips in duplicate). Data are presented as means ± SE; *P < 0.05, ***P < 0.001. Abbreviations: Akt/PKB, protein kinase B; C, condition; Erk1/2, extracellular signal-regulated kinase 1/2; RD, relative density; S6RP, S6 ribosomal protein; Src, proto-oncogene tyrosine-protein kinase Src; tet, tetracycline.
We also examined whether the variation of [Mg2+]e differently influenced the phosphorylation of Akt/PKB-Thr308, Akt/PKB-Ser473, S6RP-Ser235/236, Erk1/2-Thr202/Tyr204, Src-Tyrpan, or any of the other important signaling nodes included in PRSA in –tet and +tet cells (Figure 5). First, we incubated –tet and +tet cells in Mg2+-free salt solution (CMF-HBSS+) for 20 min. This treatment (condition 1 (C1)) led to a significant (P < 0.001 and P < 0.05, respectively) reduction (by 61 ± 8% and 47 ± 9%, respectively) of Akt/PKB-Ser473 and Erk1/2-Thr202/Tyr204 phosphorylation in +tet cells when compared with –tet cells (Figure 5B). No significant differences in the levels of phosphorylation of Akt/PKB-Thr308, S6RP-Ser235/236, and Src-Tyrpan were detected between –tet and +tet cells (Figure 5B). Next, after C1, we provided –tet and +tet cells with HBSS+ supplemented with 10 mM Mg2+ for 30 min (condition 2 (C2)). This led to a significantly higher (by 186 ± 56%; P < 0.05) phosphorylation of S6RP-Ser235/236 in the +tet cells than in the –tet cells (Figure 5C). The levels of phosphorylation of Akt/PKB-Thr308, Akt/PKB-Ser473, Erk1/2-Thr202/Tyr204, and Src-Tyrpan were not significantly different between –tet and +tet cells after C2 (Figure 5C). As we had demonstrated that INS influenced the performance of A1 via classic INS signaling involving IRTK – PI3K – Akt/PKB [11], we provided –tet and +tet cells (after C1 + C2) with CMF-HBSS+ containing INS (400 μU/mL) for 25 min (condition 3 (C3)). This treatment led to comparable levels of phosphorylation of all detectable phospho-targets in +tet and –tet cells (Figure 5D).
These data clearly indicate that A1 overexpression influences the phosphorylation (and, thus, the activity) of Akt/PKB-Ser473 and Erk1/2-Thr202/Tyr204 in Mg2+-free medium and in medium containing the physiological [Mg2+] (1 mM). Furthermore, they show that the presence of high 10 mM [Mg2+]e enhances the phosphorylation of S6RP-Ser235/236 in the +tet cells. Application of INS (400 μU/mL; 25 min) erases any differences in the phosphorylation status of Akt/PKB-Ser473 and Erk1/2-Thr202/Tyr204 resulting from the different expression niveaus of A1 in –tet and +tet cells, as seen in Mg2+-free medium and medium supplied with 1 mM Mg2+.
The sequential experimental design allowed the pairwise comparisons of the effects of particular treatments (C0, C1, C2, C3) on the phosphorylation of the respective kinases in –tet and +tet cells. None of the treatments had a significant effect on the levels of phosphorylation of Akt/PKB-Thr308 in –tet cells (Figure 6A). A significant (P < 0.05) increase of Akt/PKB-Thr308 phosphorylation was evoked by C3 when compared with C0 and C1, but not with C2, in +tet cells (Figure 6A). A significantly (P < 0.05) lower level of Akt/PKB-Ser473 phosphorylation was detected in –tet cells after C2 when compared with that after C0 (Figure 6B). In +tet cells, a significantly (P < 0.001) higher niveau of Akt/PKB-Ser473 phosphorylation was detected after C3 when compared with C0, C1, and C2 (Figure 6B). No significant changes of S6RP-Ser235/236 phosphorylation were detected upon any of the applied treatments in the –tet cells (Figure 6C). Treatment C2 led to a significantly (P < 0.001) increased phosphorylation of S6RP-Ser235/236 when compared with treatments C0, C1, and C3 in +tet cells (Figure 6C). Moreover, no significant changes of Erk1/2-Thr202/Tyr204 phosphorylation were detected following any of the applied treatments in –tet cells (Figure 6D). Erk1/2-Thr202/Tyr204 phosphorylation was significantly (P < 0.05) reduced after C1 when compared with that after C2 or C3 in +tet cells (Figure 6D). None of the treatments induced a significant change of Src-Tyrpan phosphorylation in –tet or +tet cells (Figure 6E).
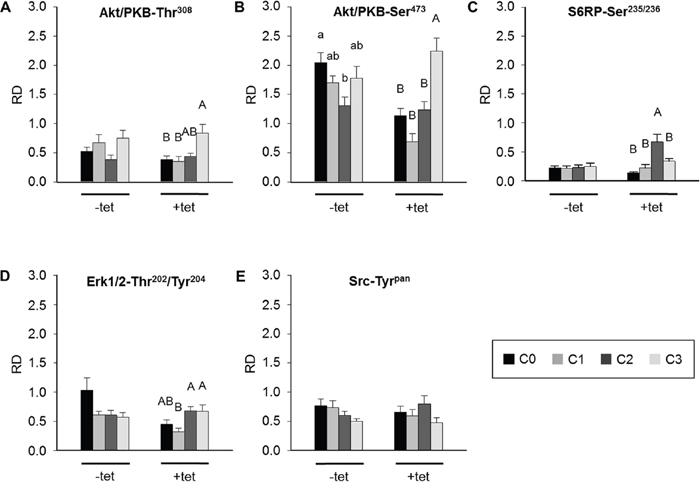
Figure 6: Between-treatments (C0, C1, C2, C3; see Figure 4 for details) comparison of averaged relative densities of (A) Akt/PKB-Thr308 phospho-signals, (B) Akt/PKB-Ser473 phospho-signals, (C) S6RP-Ser235/236 phospho-signals, (D) Erk1/2-Thr202/Tyr204 phospho-signals, and (E) Src-Tyrpan phospho-signals in –tet (control) and +tet (SLC41A1-overexpressing) HEK293 cells, as obtained with PathScan® RTK Signaling Antibody Array (PRSA). Each averaged density value results from six independent biological experiments (N/n = 6/12 (respective phospho-signals were detected on chips in duplicate)). Data are presented as means ± SE; a vs. b P < 0.05. Abbreviations: Akt/PKB, protein kinase B; C, condition; Erk1/2, extracellular signal-regulated kinase 1/2; RD, relative density; S6RP, S6 ribosomal protein; Src, proto-oncogene tyrosine-protein kinase Src; tet, tetracycline.
Taken together, the above data indicate that the modulation of [Mg2+]e and/or exposure to a high concentration of INS significantly affect the levels of Akt/PKB-Thr308 phosphorylation in +tet cells, of the Akt/PKB-Ser473 phosphorylation in both –tet and +tet cells, of the S6RP-Ser235/236 phosphorylation in +tet cells, and of the Erk1/2-Thr202/Tyr204 phosphorylation in +tet cells.
As we observed the most prominent effects of A1 overexpression and/or modulation of [Mg2+]e on the phosphorylation of Akt/PKB and Erk1/2, we decided to verify the PRSA results with Western blot (WB) analysis and densitometry.
Whereas PRSA had suggested only a numerical reduction in Akt/PKB-Thr308 phosphorylation by A1 overexpression, the WB analysis revealed that Akt/PKB-Thr308 was significantly (P < 0.01) less phosphorylated in cells overexpressing A1 and grown in the presence of [Mg2+]e at 1 mM (C0) when compared with –tet cells under the same conditions (Figures 7 and 8A). Coherent with the results obtained with PRSA, the WB data show that the phosphorylation of Akt/PKB-Ser473 is indeed significantly (P < 0.05 and P < 0.01) attenuated in +tet cells when compared with that in –tet cells, under both C0 and C1 (Figures 7 and 8B).
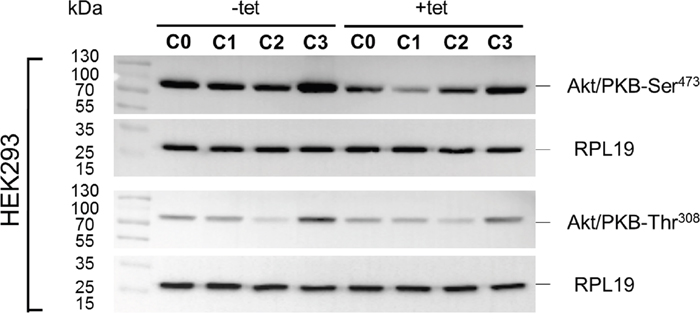
Figure 7: WB analysis of the phosphorylation status of Akt/PKB-Thr308 and Akt/PKB- Ser473 in response to the treatment conditions C0, C1, C2, or C3 (see Figure 4 for details) in –tet (control) and +tet (SLC41A1-overexpressing) HEK293 cells. One representative experiment of, in total, five independent biological experiments is shown. RPL19 was used as a loading reference and was detected subsequent to the phospho-signals on the same blots. Abbreviations: Akt/PKB, protein kinase B; C, condition; RPL19, 60S ribosomal protein L19; tet, tetracycline; WB, Western blot.
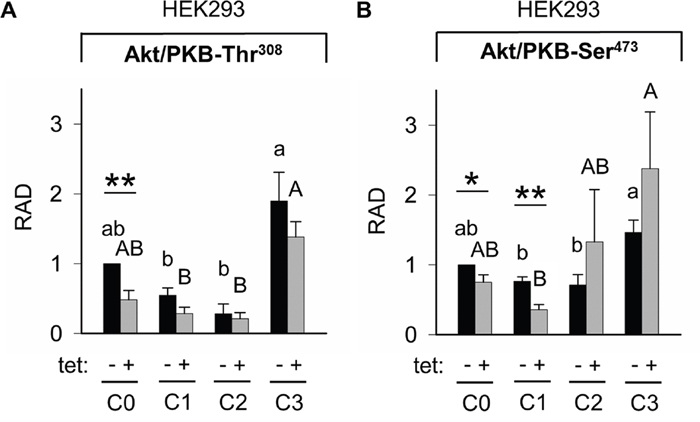
Figure 8: Pairwise comparison of relative adjusted densities of Akt/PKB-Thr308 (A) and Akt/PKB-Ser473 (B) phospho-signals and between-treatments (C0, C1, C2, C3; see Figure 4 for details) comparison of relative adjusted densities of Akt/PKB-Thr308 (A) and Akt/PKB-Ser473 (B) phospho-signals in –tet (control) and +tet (SLC41A1-overexpressing) HEK293 cells, obtained with WB. Data are presented as means (N = 5) ± SE. Pairwise comparisons: Significance is indicated (*P < 0.05, **P < 0.01). Between-treatment comparisons: Labeled means without a common letter differ (P < 0.05). Small letters were used for the between-treatment comparisons in –tet group and capital letters in +tet group. Abbreviations: Akt/PKB, protein kinase B; C, condition; RAD, relative adjusted density; tet, tetracycline; WB, Western blot.
The comparisons of Akt/PKB-Thr308 phosphorylation between treatments revealed the significantly (P < 0.05) higher level of Thr308 phosphorylation in –tet cells after C3 when compared with C1 and C2 (Figure 8A). This was also the case in +tet cells (Figure 8A). In the case of Akt/PKB-Ser473, the comparison of its phosphorylation between treatments showed a significantly (P < 0.05) increased niveau of phospho-Ser473 in –tet cells after C3 when compared with C1 and C2 (Figure 8B). In +tet cells after C3, the level of Ser473 phosphorylation was significantly (P < 0.05) higher than that after C1 (Figure 8B).
The WB analysis confirmed the PRSA results showing that Erk1/2-Thr202/Tyr204 phosphorylation was significantly (P < 0.05) reduced in cells overexpressing A1 and grown in the presence of [Mg2+]e at 1 mM (C0) when compared with –tet cells under the same conditions (Figures 9 and 10). Although the PRSA data showed a significant reduction of Erk1/2-Thr202/Tyr204 phosphorylation in +tet cells under C1 (compared with –tet cells under C1), the reduction of Erk1/2-Thr202/Tyr204 phosphorylation in +tet cells under C1 as detected with WB analysis was not significant (P = 0.17) when compared with –tet cells under C1.
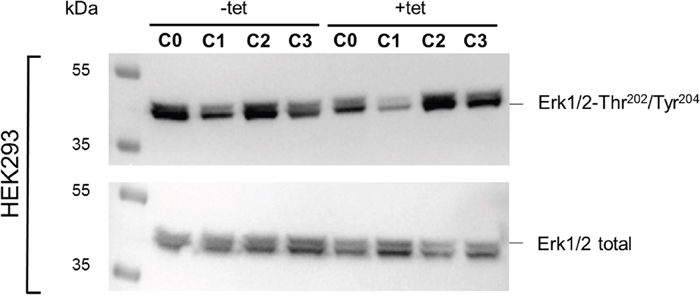
Figure 9: WB analysis of the phosphorylation status of Erk1/2-Thr202/Tyr204 in response to the treatment conditions C0, C1, C2, or C3 (see Figure 4 for details) in –tet (control) and +tet (SLC41A1-overexpressing) HEK293 cells. One representative experiment of, in total, five independent biological experiments is shown, in which total Erk1/2 and the phospho-signals of Erk1/2-Thr202/Tyr204 were detected in parallel. Abbreviations: C, condition; Erk1/2, extracellular signal-regulated kinase 1/2; tet, tetracycline; WB, Western blot.
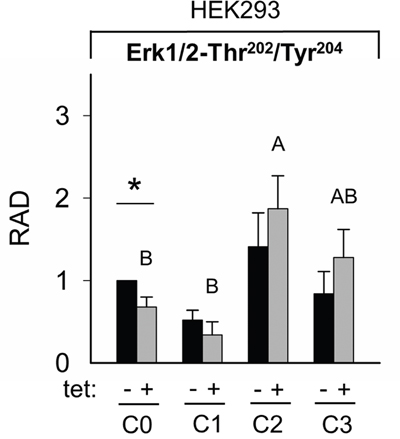
Figure 10: Pairwise comparison of relative adjusted densities of Erk1/2-Thr202/Tyr204 phospho-signals and between-treatments (C0, C1, C2, C3; see Figure 4 for details) comparison of relative adjusted densities of Erk1/2-Thr202/Tyr204 phospho-signals in –tet (control) and +tet (SLC41A1-overexpressing) HEK293 cells, obtained with WB. Data are presented as means (N = 5) ± SE. Pairwise comparisons: significance is indicated (*P < 0.05). Between-treatment comparisons: Labeled means without a common letter differ (P < 0.05). Small letters were used for the between-treatment comparisons in –tet group and capital letters in +tet group. Abbreviations: C, condition; Erk1/2, extracellular signal-regulated kinase 1/2; RAD, relative adjusted density; tet, tetracycline; WB, Western blot.
The comparisons of the Erk1/2-Thr202/Tyr204 phosphorylation between treatments revealed the significantly (P < 0.05) higher level of Thr202/Tyr204 phosphorylation in +tet cells after C2 when compared with C0 and C1 (Figure 10). However, this was not the case in –tet cells (Figure 10).
In summary, the densitometric WB and PRSA data demonstrated similar changes in the phosphorylation profile (and thus activity) of Akt/PKB and Erk1/2 in response to the expression status of A1.
Next, we examined whether the above-described attenuation of the phosphorylation of Akt/PKB triggered by A1 overexpression is a common phenomenon in various cell types, or whether it is limited to HEK293 cells only. SH-SY5Y neuroblastoma-derived cells were transfected with empty vector (SH-SY5Y-A- cells) or vector carrying and constitutively expressing A1 (SH-SY5Y-A+ cells).
Coherent with data acquired from HEK293 cells, the WB analysis revealed that Akt/PKB-Thr308 was significantly (P < 0.01) less phosphorylated in SH-SY5Y-A+ cells overexpressing A1 and grown in the presence of [Mg2+]e at 1 mM (C0) when compared with SH-SY5Y-A- cells under the same conditions (Supplementary Figures 2 and 3A). Moreover, the phosphorylation of Akt/PKB-Ser473 was significantly (P < 0.01 and P < 0.05) attenuated in SH-SY5Y-A+ cells when compared with that in SH-SY5Y-A- cells, under both C0 and C1 (Supplementary Figures 2 and 3B). No significant differences in phosphorylation of both Akt/PKB-Thr308 and Akt/PKB-Ser473 were detected between SH-SY5Y-A- and SH-SY5Y-A+ cells under either C2 or C3 (Supplementary Figures 2, 3A and 3B).
Between-treatments comparisons of Akt/PKB-Thr308 phosphorylation revealed the significantly (P < 0.05) higher level of Thr308 phosphorylation in SH-SY5Y-A- cells after C3 when compared with C1 and C2 and under C0 when compared with C2 (Supplementary Figure 3A). In SH-SY5Y-A+ cells, the latter was observed, except that no significant difference was detected between C0 and C2 (Supplementary Figure 3A). A comparison of Akt/PKB-Ser473 phosphorylation between treatments showed significantly (P < 0.05) increased levels of phosphorylated Ser473 in both SH-SY5Y-A- and SH-SY5Y-A+ cells after C3 when compared with C1 and C2, and in C0 when compared with C2 (Supplementary Figure 3B).
The Akt/PKB-Thr308 and -Ser473 phosphorylation profiles in HEK293 cells and in SH-SY5Y cells in response to the expression status of SLC41A1 and the status of the extracellular and intracellular Mg2+ largely overlaps. The levels of phosphorylation of both Thr308 and Ser473 are much higher under C3 in SH-SY5Y cells when compared with HEK293 cells suggesting (Figure 8A and 8B vers. Supplementary Figure 3A and 3B) that SH-SY5Y cells are obviously better responders regarding the INS stimulation.
Consequently, we examined the phosphorylation status of Erk1/2-Thr202/Tyr204 in SH-SY5Y-A- and SH-SY5Y-A+ cells. Similar to HEK293 cells, we detected a significant (P < 0.001) reduction of Erk1/2-Thr202/Tyr204 phosphorylation related to the overexpression of A1 in SH-SY5Y-A+ cells when compared with SH-SY5Y-A- under C0 (Supplementary Figures 4 and 5). A significantly (P < 0.05) higher phosphorylation of Erk1/2-Thr202/Tyr204 was detected in SH-SY5Y-A+ under C3 when compared with SH-SY5Y-A- cells treated in the same way (Supplementary Figure 5). This indicates that the overexpression of A1 facilitates the effect of INS on Erk1/2 phosphorylation and, thus, its activity in SH-SY5Y cells.
Statistical analysis for the between-treatment comparisons were missing in Supplementary Figure 5 and are now included in the new Supplementary Figure 5 which is attached. However, the same comparison in SH-SY5Y-A+ cells revealed significantly (P < 0.05) higher Erk1/2-Thr202/Tyr204 phosphorylation in cells treated under C3 compared with cells treated under C0 or C1 (Supplementary Figure 5).
Finally, we examined the correlation between A1 overexpression and the phosphorylation status of Akt/PKB and ERK1/2 in HeLa adenocarcinoma-derived cells with tet inducible expression of A1. Under our experimental conditions, basal phosphorylation of Akt/PKB at Ser473 and, in particular, at Thr308 was extremely low in this cell line. Low basal Akt/PKB phosphorylation in HeLa cells was also found by other authors by using the phospho-specific antibodies used in this study [31]. We therefore compared Akt/PKB phosphorylation between –tet and +tet cells in this cell line only under C3, as only INS treatment stimulated the sufficient detectable phosphorylation of both Thr308 and Ser473. As shown in Supplementary Figures 6 and 7, the INS-induced phosphorylation of Thr308 was significantly (P < 0.05) lower in +tet cells in comparison with in –tet cells. Moreover, phosphorylation of Ser473 was significantly (P < 0.01) lower in +tet cell than in –tet cells (Supplementary Figures 6 and 7).
The phosphorylation of Erk1/2-Thr202/Tyr204 in HeLa cells was well detectable under all tested conditions. Erk1/2 was significantly (P < 0.05) less phosphorylated in +tet cells when compared with –tet cells (Supplementary Figures 8 and 9). The comparison of Erk1/2 phosphorylation between –tet and +tet cells under C1, C2, and C3 revealed no significant differences (Supplementary Figures 8 and 9).
In between-treatments comparisons of Erk1/2-Thr202/Tyr204 phosphorylation in –tet cells, we found a significant (P < 0.05) difference between treatment C0 and C1 (Supplementary Figure 9). The same comparison in +tet cells revealed no significant differences between particular conditions (Supplementary Figure 9).
In brief summary, WB analyses revealed that, in HEK293 and SH-SY5Y cells, the overexpression of A1 correlated with the decrease of Akt/PKB and Erk1/2-Thr202/Tyr204 at a physiological [Mg2+]e of 1 mM (C0). The Akt/PKB phosphorylation was below the detection limit of WB in HeLa cells under all tested [Mg2+]e (C0, C1, and C2). However, it became detectable upon use of hyperinsulinemic [INS]e of 400 μU/mL with no Mg2+ being present in the bath solution, and overexpression of A1 under this condition lead to a significantly (P < 0.05, P < 0.01) lower Akt/PKB-Thr308 and -Ser473 phosphorylation when compared with Akt/PKB-Thr308 and -Ser473 phosphorylation in –tet HeLa cells.
Overexpression of SLC41A1 clearly modifies [Mg2+]i at all tested conditions
In our previous work, we have demonstrated that SLC41A1 is a functional NME that operates primarily in efflux mode under normal physiological conditions [2, 3, 4, 11]. However, A1 may operate also in reverse mode, thus conducting Mg2+ influx, but only if a sufficiently large [Mg2+]e is provided [5, 6, 13]. Here, we measured [Mg2+]i in –tet and +tet HEK293 cells after treatment C0, C1, C2, and C3. The results are summarized in Table 2. Overexpression of A1 (15 hrs) lead to a significant (P < 0.001) reduction of [Mg2+]i when compared with [Mg2+]i in control –tet cells (both –tet and +tet cells were measured at [Mg2+]e = 1 mM; C0). +Tet cells incubated 30 min in CMF-HBSS+ ([Mg2+]e = 0 mM; C1) had significantly (P < 0.001) lower [Mg2+]i when compared with [Mg2+]i in control –tet cells treated in the same way. The [Mg2+]i determined in +tet cells treated under C2 (cells were bathed for 30 min in CMF-HBSS+ and 30 min in HBSS+ containing [Mg2+]e = 10 mM) were significantly (P < 0.01) higher than the [Mg2+]i in –tet cells treated under C2. Finally, we measured [Mg2+]i in –tet and +tet cells that were bathed for 30 min in CMF-HBSS+ followed by a 30 min bath in HBSS+ containing [Mg2+]e = 10 mM and a 25 minutes bath in CMF-HBSS+ supplemented with 400 μU/mL of INS (C3). As is evident from Table 2, the [Mg2+]i measurements in –tet cells were not significantly different from those measured in +tet cells.
Table 2: [Mg2+]I measured in –tet and +tet HEK293 cells under treatments C0 through C3
Condition |
-tet |
+tet |
-tet vs. +tet |
||
|---|---|---|---|---|---|
N |
[Mg2+]i (mM) |
N |
[Mg2+]i (mM) |
||
C0 |
17 |
0.31 ± 0.08 |
15 |
0.23 ± 0.03 |
P < 0.001 |
C1 |
18 |
0.21 ± 0.07 |
18 |
0.05 ± 0.02 |
P < 0.001 |
C2 |
10 |
0.57 ± 0.06 |
10 |
0.77 ± 0.04 |
P < 0.01 |
C3 |
10 |
0.75 ± 0.07 |
10 |
0.67 ± 0.04 |
P = 0.39 |
Conditions: C0, [Mg2+]i was measured in –tet and +tet cells immediately after 30-min loading with mag-fura 2 fluorescent probe upon presence of [Mg2+]e = 1 mM; C1, [Mg2+]i was measured in –tet and +tet cells after 30-min loading with mag-fura 2 fluorescent probe in CMF-HBSS+; C2, [Mg2+]i was measured in –tet and +tet cells after 30-min loading with mag-fura 2 fluorescent probe in CMF-HBSS+ followed by 30-min incubation of the cells in HBSS+ containing 10 mM Mg2+; C3, [Mg2+]i was measured in –tet and +tet cells after 30-min loading with mag-fura 2 fluorescent probe in Mg2+-free HBSS+ followed by 30-min incubation of the cells in HBSS+ containing 10 mM Mg2+ and successively by 25-min incubation of the cells in CMF-HBSS+ provided with INS (400 μU/mL). Abbreviations: C, condition; CMF-HBSS+, Ca2+- and Mg2+-free Hank’s balanced salt solution plus 10 mM HEPES pH 7.4; tet, tetracycline.
From our previous, the expression levels of SLC41A1 significantly influence the status of [Mg2+]i under C0, C1, and C2. In contrast, under C3 (hyperinsulinemic concentration of INS), the SLC41A1 expression level did not significantly influence [Mg2+]i.
The multiple pairwise comparison of [Mg2+]i between particular conditions within the group of –tet cells (summarized in Table 3) revealed no significant difference between the [Mg2+]i of cells under C1 when compared with [Mg2+]i of cells treated under C0. However, [Mg2+]i of cells under C1 were significantly (P < 0.05) lower when compared with [Mg2+]i of cells under C2 or C3. The concentrations of intracellular Mg2+ measured in cells under C2 were not significantly different from Mg2+ concentrations determined in cells under C0 or C3; [Mg2+]i of cells under C0 were significantly (P < 0.05) lower when compared with [Mg2+]i of cells under C3.
Table 3: Pairwise comparisons of [Mg2+]i measured separately in –tet HEK293 cells or in +tet HEK293 cells under C0 through C3
tet |
-tet |
+tet |
||||||
|---|---|---|---|---|---|---|---|---|
Condition |
C0 |
C1 |
C2 |
C3 |
C0 |
C1 |
C2 |
C3 |
[Mg2+]i(mM) |
0.31 |
0.21 |
0.57 |
0.75 |
0.23 |
0.05 |
0.77 |
0.67 ± 0.04 |
Significance (defined by P < 0.05) |
bc |
c |
ab |
a |
B |
C |
A |
AB |
Conditions were as previously described in legend for Table 2. Letter code indicates statistically significant differences between compared datasets. Abbreviations: C, condition; tet, tetracycline.
The multiple pairwise comparison of [Mg2+]i between particular conditions within the group of +tet cells (summarized in Table 3) showed that [Mg2+]i of cells under C1 were significantly (P < 0.05) lower than [Mg2+]i of cells treated under C0, C2, or C3. [Mg2+]i of cells under C2 were significantly (P < 0.05) higher when compared with [Mg2+]i of cells under C0 and C1, but not C3. [Mg2+]i of cells under C3 were significantly (P < 0.05) higher than [Mg2+]i of cells under C1, but not C0 or C2.
DISCUSSION
The involvement of Mg2+ in more than 300 distinctive enzymatic reactions and key cellular processes substantiates the need for the efficient cellular regulation of [Mg2+]i [1]. Regulated active Mg2+ transport mechanisms are essential for the maintenance of IMH [7].
Extracellular signals (e.g., hormones) and intracellular signaling play an important role in the regulation of Mg2+ transporters and, thus, IMH [1]. However, the paucity of information concerning the molecular biology of the respective cellular Mg2+ transport systems makes our understanding of the role of cellular signaling in IMH incomplete.
NME A1 is a key component of IMH regulation and is still the only known ubiquitously expressed Mg2+ efflux system in cells [4–7, 10, 11, 13]. Recently, we have demonstrated that INS regulates the NME activity of A1 via the “classic” signaling cascade IRTK – PI3K – Akt/PKB [13]. Moreover, ANG has been implicated in the regulation of NME [32]. Both INS and ANG influence intracellular cAMP levels and, consequently, the PKA activity that triggers A1 activity [13, 33].
Overexpression of A1 results in a decrease of the basal [Mg2+]i in cells cultured at the physiological [Mg2+]e of 1 mM (Tables 2 and 3) [4, 5]. Goytain and Quamme have demonstrated that a restriction of Mg2+ intake induces the upregulation of A1 expression in mice [34]. Nothing is known about the signaling involved in the regulation of A1 transcription, apart from the work of Romanuik and Hwang [24] who have identified A1 as being an androgen-responsive gene and who have therefore assumed the existence of AREs in regulatory sequences surrounding the coding regions of A1 [24, 25]. Furthermore, nothing is known about the impact of A1 overexpression on cellular signaling and complex cell physiology.
Our data (Figure 2) demonstrate that the overexpression of A1 completely changes the SFLLR-NH2- and [Mg2+]e-induced DMR fingerprint of HEK293 cells, thus identifying the A1 expression level as being a bona fide discriminant able to modify complex cellular responses to external signals translated into a measurable DMR signal. Indeed, these data indicate that not only extracellular signals and adjacent afferent signaling influence A1 (or A1) at the transcriptional and the functional levels, but also vice versa, i.e., that levels of A1 transcription influence intracellular signaling.
Akt/PKB has a central role in cellular signaling and in the regulation of proliferation, growth, and apoptosis [35, 36]. The phosphorylation of Thr308 activates Akt/PKB, although the phosphorylation of Thr308 and Ser473 is required for its full activity. Significantly, the phosphorylation of Ser473 alone has little effect on Akt/PKB activity [35, 36]. Several studies have implicated Mg2+ in the regulation of Akt/PKB activity [37, 38]. Krueger et al. have demonstrated that elevated [Mg2+]e (3.3 mM) increases cell proliferation in neural cells in culture and have observed that increased Akt/PKB activation, comparable with activation by INS (200 nM), follows Mg2+ treatment [37]. The activity of Akt/PKB results from the orchestrated actions of kinase PDK-1, which phosphorylates Thr308; kinase complex mTOR/RICTOR/GβL, which phosphorylates Ser473; kinase PI3K, which phosphorylates both Thr308 and Ser473 in Akt/PKB isoform 1 or Ser474 alone in isoform 2; phosphatase PP2A, which dephosphorylates Thr308; and the PHLPP phosphatases, which dephosphorylate Ser473 [39–44]. PHLPP is a member of the protein phosphatase Mg2+-activated (PPM) subfamily of phosphatases. It requires Mg2+ for its catalytic activity [44]. Mg2+ also plays a role in the activation of PP2A, but only in complex with ATP [45]. Low [Mg2+]e is also assumed to activate PI3K [46].
Here, we have demonstrated that the overexpression of NME A1 significantly attenuates the phosphorylation of Akt/PKB at both Thr308 and Ser473 (Figures 5A, 5B, 8A, 8B, Supplementary Figure 3). These data nicely complement the aforementioned work of Krueger and colleagues [37]. However, the above also indicates that the low [Mg2+]i that results from the overexpression of A1 should down-regulate PHLPP, and perhaps PP2A, and activate PI3K to increase the phosphorylation of both Thr308 and Ser473 or at least to keep their phosphorylation status at a sustained level (Supplementary Figure 10A). Hence, an as yet unknown regulatory mechanism must exist that is potent enough to increase the activity of PHLPP and PP2A and to decrease that of PI3K, PDK-1, and mTOR/RICTOR/GβL at the lower [Mg2+]i induced by the overexpression of A1 (Supplementary Figure 10B). Whether such a regulator is the recently identified Mg2+ homeostatic factor CNNM2 remains to be examined [47].
Further, our data indicate that the variation of extracellular Mg2+ (C1, C2) also contributes to the modulation of the Akt/PKB phosphorylation on Thr308 and Ser473 in both the cells with endogenous A1 expression and A1-overexpressing cells, although the expression status of A1 remains a superior discriminant compared with the status of [Mg2+]e. Our results also suggest that INS stimulates the phosphorylation of both Thr308 and Ser473 independently of the presence of Mg2+ in the extracellular solution. The latter is also supported by the observation that, irrespective of A1 expression status, the presence of [Mg2+]e = 10 mM (C2) was insufficient to increase the phosphorylation of Akt/PKB (at both Thr308 and Ser473) beyond the WB detection threshold in HeLa cells, whereas the hyperinsulinemic concentration of INS induced a detectable massive phosphorylation of both Thr308 and Ser473 of Akt/PKB in these cells, even without presence of Mg2+ in external solution (Supplementary Figures 6 and 7).
Notably, Erk1/2-Thr202/Tyr204 phosphorylation is significantly reduced in +tet HEK293 and in +tet HeLa and SH-SY5Y-A+ cells in the presence of physiological Mg2+ (1 mM) or with no Mg2+ (only in HEK293 cells) in the bath solution (Figures 5A, 5B, 10, Supplementary Figures 5 and 9). The phosphorylation of both Thr202 and Tyr204 residues is required for its activity [48]. Therefore, we can conclude that the overexpression of A1 contributes to the reduction of Erk1/2 kinase activity and thus to the modulation of its signaling in processes such as proliferation and/or apoptotic events in cells [49, 50]. The Ras – Erk1/2 and PI3K – Akt/PKB – mTORC1 pathways regulate each other via cross-inhibition and cross-activation [51]. Our data indicate that the lack of [Mg2+]i, caused by the overexpression of A1 in the +tet cells bathed in medium containing no Mg2+ or 1 mM Mg2+ leads to an attenuation of both cascades (Tables 2 and 3) [4, 5]. Indeed, one can speculate that oscillations of [Mg2+]i play a critical role in the regulation of both the aforementioned cascades and their crosstalk. Hence, from a larger perspective, A1 can be assumed to play a significant role in the regulation of Erk1/2 and Akt/PKB signaling and their orchestration in basic cellular processes, such as proliferation and apoptosis.
Ser/Thr kinase mTOR is a key integrator of growth-factor-activated and nutrient-sensing pathways in the cell. It is activated by Akt/PKB, which phosphorylates tuberin (TSC2) at multiple sites relieving the inhibitory effects of the hamartin-tuberin (TSC1-TSC2) complex on Rheb and mTOR complex 1 (mTORC1) [52–54]. Activated mTORC1 phosphorylates ribosomal S6 kinase (S6K1), which phosphorylates S6RP [54]. Thus, the increased phosphorylation of S6RP on Ser235/236, as seen only in A1-overexpressing cells at high [Mg2+]e, indicates the increased activity of mTOR (Figure 5C). In our previous work, we have shown that the presence of high [Mg2+]e (10 mM) is potent enough to revert the mode of A1 operation from Mg2+-extrusion to Mg2+-influx leading to a significant increase of [Mg2+]i in A1-overexpressing cells [4–6]. Therefore, both the increase of [Mg2+]i and the increased levels of A1 expression can be assumed to be necessary to stimulate mTOR signaling. In contrast, the overexpression of A1 paralleled with the presence of no Mg2+ or physiological [Mg2+] (1 mM) in the bath solution significantly attenuates the phosphorylation of Thr308 and Ser473 of Akt/PKB in the +tet cells (Figures 5A, 5B, 8A, 8B, Supplementary Figure 3), and, hence, under this condition, the attenuated Akt/PKB activity leads to the increased stability of the TSC1-TSC2 complex and the silencing of mTOR signaling (when compared with [Mg2+](10 mM); Figure 5A, 5B, 5D) [52]. Rubin has proposed mTOR as a key player in his Membrane-Magnesium-Mitosis (MMM) model, which holds that any rise in [Mg2+]i increases MgATP2- and activates mTOR [55]. Whereas most of the kinases in the PI3K - Akt/PKB – mTOR signaling cascade have a low Km for MgATP2-, mTOR has a high requirement that approximates the level of free Mg2+ in the cell [55]. Furthermore, the intracellular levels of free Mg2+ might play a crucial role in the regulation of the activities of the principal mTOR modulators such as Rheb and Rag GTPases [56–58]. Thus, A1 (its functional and expression status) as a prominent regulator of [Mg2+]i and of Akt/PKB activity is a factor of paramount importance in the MMM model.
Perturbed Akt/PKB signaling has been implicated in several serious ailments, e.g., peripheral INS resistance and diabetes, Alzheimer’s and Parkinson’s diseases (AD, PD), and cancer [59–61]. In particular, in cancer, the increased activity of Akt/PKB is considered as being a major factor defining the invasive abilities of tumors [61]. For example, the constitutive phosphorylation of Akt/PKB, particularly on Ser473, is associated with poor prognosis in acute myeloid leukemia [62]. Increased Akt/PKB expression and activity have been detected in aggressive human gastric cancers and in breast, prostate, ovarian, and brain tumors [63]. Thus, an understanding of the modalities influencing Akt/PKB activity is absolutely essential for the effective targeting and manipulation of Akt/PKB activity in the aforementioned diseases.
Hypomagnesemia and intracellular Mg2+ deficiency are the hallmarks of diseases such as diabetes, AD, or PD and are assumed negatively to influence the course of these diseases and therapeutic outcomes [1, 11]. In contrast, cancer cells are known to retain higher Mg2+ concentrations, in agreement with the pro-proliferative effect of Mg2+ [34, 64]. Although the identity of NME was unknown at the time, Wolf and Cittadini predicted as early as 1999 that, in tumor cells, the disturbed Mg2+ content is probably attributable to the inhibition of Mg efflux via the Na+/Mg2+ antiporter [64]. Mastrototaro et al. have recently demonstrated that the INS-activated IRTK – PI3K – Akt/PKB signaling axis constitutes an important mechanism controlling the activity of NME A1 [13]. Our present work not only complements the work of Wolf and Cittadini and of Mastrototaro et al., but also most importantly demonstrates that the mutual control of the functions of Akt/PKB (and of Erk1/2 and mTOR) and A1 is delicately balanced, and that the deregulation of either one might result in disease.
Our results also provide support for the role of IMH and the genetics of its molecular constituents in the pathophysiology of prominent human ailments such as cancer. Various aberrant ion-transporting proteins (channels, pumps, and carriers) or the deranged expression of their normal (healthy) variants have been experimentally linked to the process of tumorigenesis (tumor development and progression) [67]. However, the involvement of NME in tumorigenesis has only been hypothesized [64]. Our data provide a solid piece of evidence that NME A1 influences the Akt/PKB signaling node, which thus might interfere with molecular mechanisms discriminating between pro-apoptotic and pro-survival cellular events. In the future, the correlation of the transcriptional and functional parameters of NME A1 and Akt/PKB signaling in cancer and also the other disease conditions mentioned above will be of great interest.
We conclude that the expression status of A1 and the status of [Mg2+]e (and consequently also of [Mg2+]i) play a role in the regulation of Akt/PKB and Erk1/2 activities and the complex physiological response to extracellular stimuli. The levels of expression of A1 might be considered as a molecular marker in disease conditions hallmarked by disrupted Akt/PKB signaling and/or disturbed IMH. Furthermore, the pharmacological management of the expression and function of A1 might find its place in the therapy of “Akt-opathies”.
MATERIALS AND METHODS
Cloning of SLC41A1 into pcDNA5/TO
The coding sequence of SLC41A1 with an N-terminal HA- (hemagglutinin) tag and a C-terminal strep-tag was produced by gene synthesis (ShineGene Bio-Technologies, Inc.) and cloned into pcDNA5/TO via the restriction sites KpnI and XhoI.
Cell culture
HEK293(tet)↑(FLAG-SLC41A1); stable tetracycline-(tet)-inducible HEK293 cells overexpressing N-terminal FLAG-tagged Na+/Mg2+ exchanger A1. Cells were cultured as previously described by Kolisek and colleagues [4, 5]. Protein expression was induced by the addition of tetracycline (1 μg/mL) for 15 hours. The detailed characteristics of A1 expression in HEK293(tet)↑(FLAG-SLC41A1) cells have been published previously [4, 5]. No leakiness of the expression of recombinant SLC41A1 was detected in –tet cells (Supplementary Figure 11).
The T-REx™-HeLa cell line was purchased from Thermo Fisher Scientific and grown in DMEM (Biochrom) supplemented with 10% FBS and stable glutamine, 1% Pen-Strep, and 5 μg/ml blasticidin.
The human neuroblastoma cell line SH-SY5Y (ATCC CRL-2266) was cultured in Dulbecco’s MEM/Ham’s F-12 (1:1) (Biochrom) supplemented with 10% FBS and stable glutamine and 1% Pen-Strep.
Transient transfection of SH-SY5Y and HeLa cells
SH-SY5Y and HeLa cells were transiently transfected with pcDNA5/TO-SLC41A1 or the respective empty control vector by using TurboFect transfection reagent (Thermo Fisher Scientific). For SH-SY5Y, three million cells were seeded per T-75 flask and grown overnight. Subsequently, cells were transiently transfected with the empty vector or the vector harboring SLC41A1 and grown for a further 24 hours. Expression was verified by WB (Supplementary Figure 11).
T-REx™-HeLa cells stably expressing the Tet-repressor were seeded at a density of two million cells per T-75 flask and grown for 24 hours prior transfection. Cells were then transiently transfected and allowed to recover for further 24 hours. Finally, protein expression was induced by the addition of tetracycline (1 μg/mL) for 24 hours. Control cells transfected with pcDNA5/TO-SLC41A1 remained uninduced. Efficient expression of A1 in transiently transfected cells was controlled by immunoblotting with a primary mouse antibody directed against the Strep-tag (1:2,500, Qiagen) in combination with a horseradish peroxidase (HRP)-conjugated secondary antibody (anti-mouse, 1:2,000; from Cell Signaling Technology). No background expression in the absence of tetracycline was detected in HeLa cells as confirmed by immunoblotting (Supplementary Figure 11).
Cell preparation for label-free assays
HEK293(tet)↑(FLAG-SLC41A1) cells were harvested at 70-80% confluency and seeded into label-free fibronectin-coated microplates (PerkinElmer) in serum-containing medium at a density of 20,000 cells/well. Post-seeding, all cells were incubated at room temperature for 30 minutes prior to overnight incubation under 5% CO2 at 37°C. To induce protein expression, cells were incubated, as mentioned above, in label-free microplates.
Dynamic mass redistribution assay and imaging
Cells were washed three times in 25 μL/well assay buffer (Ca2+- and Mg2+-free Hank’s balanced saline (CMF-HBSS, Biochrom) plus 10 mM HEPES pH 7.4 (CMF-HBSS+)). Washing was carried out by using an aspiration wand and a multichannel pipette. The final volume was 30 μL/well, and potential air bubbles were removed by centrifugation of the plate (400 rpm x 1 min). The label-free microplates were equilibrated for 1 hour at 37°C in an EnSight Multimode Plate Reader (PerkinElmer). DMR signals were measured by using the EnSight Multimode Plate Reader equipped with Corning Epic® label-free technology (http://www.perkinelmer.com/pages/020/labelfree/default.xhtml). An initial baseline measurement was taken for 30 min. The addition of SFLLR-NH2 (5 μM), of Mg2+ (1, 3, or 10 mM), of Mg2+ (1, 3, or 10 mM) and INS (400 μU/mL), or of assay buffer only was followed by a 36-min kinetic measurement. During the whole measurement, the EnSight Multimode Plate Reader was kept at a stable temperature of 37°C. The kinetic data were referenced to the last time point of the baseline measurement.
Brightfield images were acquired by using the well-imaging module of the EnSight Multimode Plate Reader and were taken before the addition of the particular effector, but immediately after the label-free measurement and 90 min after the end of the measurement to allow for a cell confluence comparison over the duration of the experiment. Cell confluence was determined by using the pre-defined Brightfield Confluence analysis method with Kaleido Data Acquisition and Analysis Software (PerkinElmer) as provided by the plate reader.
PathScan® RTK signaling antibody array-(PRSA)-based investigation of the phosphorylation level of kinases and key signaling nodes in –tet and +tet cells
Four individual aliquots of –tet and +tet HEK293(tet)↑(FLAG-SLC41A1) cells were washed once with completely divalent-cation-free Dulbecco’s phosphate-buffered saline (DPBS) and subsequently with CMF-HBSS+. After these washing steps, the first aliquots of –tet and +tet cells were directly lysed (C0) in 1x Cell Lysis Buffer (New England Biolabs), whereas the other aliquots were incubated in CMF-HBSS+ for 20 min at 37°C (C1). Cells were subsequently pelleted and resuspended in CMF-HBSS+ plus 10 mM MgCl2 and incubated for 30 min at 37°C (C2). Finally, cells were transferred to CMF-HBSS+ supplemented with 400 μU/mL INS and incubated for another 25 min (C3). After each change of the incubation conditions, one aliquot of –tet and +tet cells was lysed in 1x Cell Lysis Buffer. Unsolubilized material was pelleted by centrifugation (14,000 rpm, 10 min, 4°C). The protein concentration of the sample was determined with the Pierce 660 nm protein assay (Thermo Fisher Scientific), and lysates were diluted to a protein concentration of 0.8 mg/mL. The PRSA Kit (New England Biolabs) was used according to the manufacturer’s instructions. Cell lysates were incubated on slides overnight at 4°C. The chemiluminescence detection of the spots was performed with the ChemiDoc MP imaging system (Bio-Rad), and spot intensities were quantified with the inbuilt software Image LabTM 5.2.1 (Bio-Rad). The presented relative densities (RD) were calculated from the pixel densities of particular phospho-signals normalized to the pixel densities of positive control spots printed on the chip.
Determination of phosphorylation status of Akt/PKB in response to overexpression of A1
For the WB detection of Ser473- and Thr308-phosphorylated Akt, –tet and +tet cells were treated exactly as described above for PRSA. Unsolubilized material was pelleted by centrifugation (14,000 rpm, 10 min, 4°C), and the protein concentration was determined by the Pierce 660 nm protein assay (Thermo Fisher Scientific). For HEK293(tet)↑(FLAG-SLC41A1) cells, 30 μg total protein was used for immunoblotting. The same protein amount was used for immunodetection with HeLa cells. For the detection of the phosphorylation status of Akt/PKB-Thr308 or Akt/PKB -Ser473 in SH-SY5Y, 20 μg total protein were loaded for conditions C0-C2 and 5 μg for C3. For the detection of Erk1/2-Thr202/Tyr204 or total Erk1/2 in SH-SY5Y, 20 μg of total protein was used for all conditions. Protein samples were run on 10% SDS-PAA gels and transferred to polyvinylidene difluoride (PVDF) membranes. For immunodetection, (1) monoclonal rabbit antibodies recognizing either Akt/PKB-Thr308 or Akt/PKB -Ser473 (Phospo-Akt Thr308 clone D25E6, and Phospo-Akt Ser473 clone D9E; both from New England Biolabs) diluted (1:800 and 1:1,000, respectively) in 2.5% milk TBS-T (Tris-buffered saline and Tween 20) were used in combination with a horseradish peroxidase (HRP)-conjugated secondary anti-rabbit antibody (1:2,500, Promega) or (2) polyclonal rabbit antibodies recognizing either Erk1/2-Thr202/Tyr204 or total Erk1/2 (both from New England Biolabs) diluted (both 1:1,000) in 2.5% milk TBS-T were used in combination with a HRP-conjugated secondary anti-rabbit antibody (1:2,500, Promega). An antibody against RPL19 (Abnova), together with an HRP-coupled anti-mouse secondary antibody (Promega), was used to detect the loading control. Proteins were visualized with the Clarity™ ECL Western Blotting Substrate (Bio-Rad). Image J software (http://rsb.info.nih.gov/ij/) and Image LabTM 5.2.1 software (BioRad) were used for the densitometric analysis of WB.
Relative adjusted densities (RAD) were calculated from the relative densities (RD) of Akt/PKB-Thr308 or Akt/PKB-Ser473 and of RPL19 bands (RAD = RDAkt/PKB /RDRPL19).
RAD were calculated for Erk1/2 from RD of phosphorylated Erk1/2-Thr202/Tyr204 and of total Erk1/2 bands (RAD = RDErk1/2-Thr202/Tyr204/RDErk1/2(total)).
RD were calculated as the pixel density (D) of the particular –tet and +tet bands obtained after treatment C0, C1, C2, or C3 divided by D of reference bands (corresponding to those obtained after treatment C0 in –tet cells).
Due to inconsistencies in membrane stripping in SH-SY5Y and HeLa cells we decided for total protein staining as normalization method for the detection of Erk1/2-Thr202/Tyr204 phosphorylation in these cell lines. The TGX Stain-FreeTM FastCastTM Kit (Bio-Rad) was used to prepare 10% SDS-PAA gels. Protein detection with this technique is based on trihalo-compound modification of tryptophan residues and has proven to be superior to the conventional detection of housekeeping-proteins [68–70]. Loaded protein amounts were as described previously and gels for the detection of total and phosphorylated Erk1/2 were run in parallel. Prior to immunoblotting the stain-free gels were UV-activated for 1 min and pictures were taken using the ChemiDoc MP imaging system (Bio-Rad, Supplementary Figure 12A, Supplementary Figure 13A, Supplementary Figure 14A, Supplementary Figure 15A). Proteins were transferred to PVDF membranes and proteins on the membrane were imaged and quantified using Image LabTM 5.2.1 software (Supplementary Figure 12B, Supplementary Figure 13B, Supplementary Figure 14B, Supplementary Figure 15B).
RD for total Erk1/2 and phosphorylated Erk1/2-Thr202/Tyr204 was first normalized on total protein (RDErk1/2(total)/RDtotal protein = RDNErk1/2(total)) and RDErk1/2-Thr202/Tyr204/RDtotal protein = RDNErk1/2-Thr202/Tyr204) and RAD were calculated from the normalized relative densities (RDN) of phosphorylated Erk1/2-Thr202/Tyr204 and normalized total Erk1/2 (RAD = RDNErk1/2-Thr202/Tyr204 /RDNErk1/2(total)).
Mag-fura 2 assisted Mg2+-measurements
The −tet and +tet HEK293(tet)↑(FLAG-SLC41A1) cells were rinsed twice with ice-cold, completely divalent, cation-free DPBS, detached by HyQtase (HyClone), centrifuged, washed in CMF-HBSS+, and resuspended in HBSS+ supplemented with [Mg2+] = 1 mM. Loading of cells with mag-fura 2 AM were performed as following: (C0) 30-min loading with mag-fura 2 in presence of [Mg2+]e = 1 mM. [Mg2+]i were measured in –tet and +tet cells immediately after a 30-min loading period; (C1) 30-min loading with mag-fura 2 in CMF-HBSS+. [Mg2+]i were measured in –tet and +tet cells immediately after a 30-min loading period. Notably, the duration of the C1 treatment for mag-fura 2-assisted [Mg2+]i measurements was extended by 10 min when compared with the duration of the C1 treatment in phosphorylation experiments. This extension was necessary to allow for the sufficient mag-fura 2 AM loading into cells and its activation (de-esterification) by intracellular esterases; (C2) 30-min loading with mag-fura 2 in CMF-HBSS+ plus 30-min incubation of the cells in HBSS+ containing 10 mM Mg2+. [Mg2+]i were measured in –tet and +tet cells immediately after 30-min Mg2+ loading period; (C3) 30-min loading with mag-fura 2 in Mg2+-free HBSS+ plus 30 min incubation of the cells in HBSS+ containing 10 mM Mg2+ and followed by 25-min incubation of the cells in CMF-HBSS+ provided with INS (400 μU/mL, measuring solution). The following [Mg2+]e were present in the measuring media under the respective conditions: C0, 1 mM; C1, 0.00 mM; C2, 10 mM; C3, 0.00 mM. Moreover, under C3, INS (400 μU/mL) was added to the measuring medium. Measurements were executed at 37°C in 3-ml cuvettes containing 2 ml cell suspension while being stirred. [Mg2+]i were determined by measuring the fluorescence of the probe-loaded cells in a spectrometer (LS50B and LS55, both PerkinElmer Life Science) by using the fast-filter accessory (340/380 nm; PerkinElmer Life Science). [Mg2+]i values were calculated according to previous reports 10,13,20. Minimum (Rmin) and maximum (Rmax) ratios for calibration were determined at the end of each experiment by using digitonin (SigmaAldrich). Rmax was found by the addition of MgCl2 to its final concentration of 25 mM in the absence of Ca2+, whereas Rmin was obtained by the addition of 50 mM EDTA, pH 7.2 (SigmaAldrich). Averaged values of [Mg2+]i were calculated from 20-s data sets. The effective frequency of data acquisition was 20 ms. Thus, for the calculation of any given averaged [Mg2+]i, 1000 data points were used. Measurements for each respective group were acquired at least on three separate occasions.
Statistics
(1) The two-tailed Student’s t-test was used to compare differences between two means (Tables 1 and 2, Figures 5, 8, 10, Supplementary Figure 3, Supplementary Figure 5, Supplementary Figure 7, Supplementary Figure 9). (2) A post hoc Tukey one-way analysis of variance (ANOVA) or Kruskal–Wallis one-way ANOVA on ranks was used to perform a multiple comparison between treatment groups (C0, C1, C2, and C3) in the –tet or +tet groups (Table 3, Figures 6, 8, 10, Supplementary Figures 3, 5, 9). A Shapiro-Wilk normality test was used for (2). Data are presented as means ± SE. Differences of P < 0.05 were considered significant. Statistical analyses were executed by means of SigmaPlot 11.0 (Systat Software, Inc.). The same software was used to generate graphs.
Abbreviations
AD: Alzheimer’s disease; Akt/PKB: protein kinase B; ANG: angiotensin II; AR: androgen receptor; AREs; androgen-responsive elements; CMF-HBSS: Ca2+- and Mg2+-free Hank’s balanced salt solution; CMF-HBSS+: Ca2+- and Mg2+-free Hank’s balanced salt solution plus 10 mM HEPES pH 7.4; c-Src (Src): proto-oncogene tyrosine-protein kinase Src; D: pixel density; DMR: dynamic mass redistribution; DPBS: Dulbecco’s phosphate-buffered saline; EGF: epidermal growth factor; EGFR: epidermal growth factor receptor; Erk1/2: extracellular signal-regulated kinase 1/2; FAK: focal adhesion kinase; GβL: G protein beta subunit like; GH: growth hormone; GHR: growth hormone receptor; IMD: intracellular Mg2+ deficiency; IMH: intracellular magnesium homeostasis; INFγ: interferon-gamma; INFγR: interferon-gamma receptor; INS: insulin; IGF-1; insulin-like growth factor 1; IRS1 and IRS2: insulin receptor substrate 1 and 2; IRTK: insulin receptor tyrosine kinase; JAK2: Janus kinase 2; L: leptin; LIF: leukemia inhibitory factor; LIFR: leukemia inhibitory factor receptor; mTOR: mechanistic target of rapamycin; mTORC1: mechanistic target of rapamycin complex 1; NME: Na+/Mg2+ exchanger; PAR-1: protease-activated receptor 1; PD: Parkinson’s disease; PDE3b: phosphodiesterase 3b; PDGF: platelet-derived growth factor; PDGFR: platelet-derived growth factor receptor; PDK-1: 3-phosphoinositide dependent protein kinase-1; PHLPP: PH domain and leucine-rich repeat protein phosphatase 1; PI3K: phosphatidylinositol-4,5-bisphosphate 3-kinase; PKA: protein kinase A; PP2A: protein phosphatase 2; PRSA: PathScan® RTK Signaling Antibody Array; PTPA: protein tyrosine phosphatase; RAD: relative adjusted density; RD: relative density; RICTOR: rapamycin-insensitive companion of mTOR; RPL19: 60S ribosomal protein L19; RTK: receptor tyrosine kinase; S6K1: ribosomal S6 kinase; S6RP: S6 ribosomal protein; SFLLR-NH2: protease-activated receptor 1 activating peptide; SLC41A1: solute carrier family 41 member A1; TBS-T; Tris-buffered saline and Tween 20; tet: tetracycline; TSC1: hamartin; TSC2: tuberin; TSC1-TSC2; hamartin-tuberin complex; WB: Western blot.
Author contributions
MK designed the study; GS, NF, JRA, PR, and MR contributed to the study design; GS, NA, NF, IP, and MC performed the experiments; GS, NA, NF, JRA, PR, and MK analyzed the data; LM performed the statistical analysis; MK wrote the paper; GS and NF contributed to the writing of the manuscript. All authors read the manuscript and approved its final version.
ACKNOWLEDGMENTS
Our gratitude is due to Martin Marak (FU Berlin and BioMed Martin) for competent technical support and to Ralf-Jügen Kühl (Perkin Elmer) for logistic support of the project. Our thanks are also extended to Dr. Zuzana Tatarkova (BioMed Martin), Dr. Friederike Stumpff (FU Berlin), and Dr. Tanja Werner (Protina GmbH.) for critical comments on the manuscript, and to Dr. Theresa Jones for linguistic corrections.
CONFLICTS OF INTEREST
MK and MR are discoverers on patent PCT/EP2011/065979 Na+/Mg2+ exchanger published as CA2811538A1, EP2431386A1, EP2431386B1, WO2012035088A1, US20130174289A1. Other authors have no conflicts of interests to disclose.
FUNDING
This work was supported primarily by a research grant from the German Research Foundation (DFG), KO-3586/3-2 to MK; and by the grant program of the Government of the Slovak Republic, “Návrat domov” to MK.
REFERENCES
1. Nishizawa Y, Morii H, Durlach J. (2007) New Perspectives in Magnesium Research (Nutrition and Health), 1st edn, Springer-Verlag Ltd., London. https://doi.org/10.1007/978-1-84628-483-0.
2. Barbiroli B, Iotti S, Cortelli P, Martinelli P, Lodi R, Carelli V, Montagna P. Low brain intracellular free magnesium in mitochondrial cytopathies. J Cereb Blood Flow Metab. 1999; 19:528-32.
3. Barbiroli B, Iotti S, Lodi R. Improved brain and muscle mitochondrial respiration with CoQ. An in vivo study by 31P-MR spectroscopy in patients with mitochondrial cytopathies. Biofactors. 1999; 9:253-60.
4. Kolisek M, Launay P, Beck A, Sponder G, Serafini N, Brenkus M, Froschauer EM, Martens H, Fleig A, Schweigel M. SLC41A1 is a novel mammalian Mg2+ carrier. J Biol Chem. 2008; 283:16235-47. https://doi.org/10.1074/jbc.M707276200.
5. Kolisek M, Nestler A, Vormann J, Schweigel-Röntgen M. Human gene SLC41A1 encodes for the Na+/Mg2+ exchanger. Am J Physiol Cell Physiol. 2012; 302:C318-26. https://doi.org/10.1152/ajpcell.00289.2011.
6. Kolisek M, Sponder G, Mastrototaro L, Smorodchenko A, Launay P, Vormann J, Schweigel-Röntgen M. Substitution p.A350V in Na+/Mg2+ exchanger SLC41A1, potentially associated with Parkinson’s disease, is a gain-of-function mutation. PLoS One. 2013; 8:e71096. https://doi.org/10.1371/journal.pone.0071096.
7. Fleig A, Schweigel-Röntgen M, Kolisek M. Solute Carrier Family SLC41, what do we really know about it? Wiley Interdiscip Rev Membr Transp Signal. 2013. https://doi.org/10.1002/wmts.95.
8. Kisters K, Tokmak F, Kosch M, Hausberg M. Role of the Na+/Mg2+ exchanger in hypertensions. Am J Hypertens. 2003; 16:95-6.
9. Sontia B, Touyz RM. Magnesium transport in hypertension. Pathophysiology. 2007; 14:205-11. https://doi.org/10.1016/j.pathophys.2007.09.005.
10. Kolisek M, Galaviz-Hernández C, Vázquez-Alaniz F, Sponder G, Javaid S, Kurth K, Nestler A, Rodríguez-Moran M, Verlohren S, Guerrero-Romero F, Aschenbach JR, Vormann J. SLC41A1 is the only magnesium responsive gene significantly overexpressed in placentas of preeclamptic women. Hypertens Pregnancy. 2013; 32:378-89. https://doi.org/10.3109/10641955.2013.810237.
11. Kolisek M, Montezano AC, Sponder G, Anagnostopoulou A, Vormann J, Touyz RM, Aschenbach JR. PARK7/DJ-1 dysregulation by oxidative stress leads to magnesium deficiency: implications in degenerative and chronic diseases. Clin Sci (Lond). 2015; 129:1143-50. https://doi.org/10.1042/CS20150355.
12. Vormann J, Magdorf K, Günther T, Wahn U. Increased Na+/Mg2+ antiport in erythrocytes of patients with cystic fibrosis. Eur J Clin Chem Clin Biochem. 1994; 32:833-6.
13. Mastrototaro L, Tietjen U, Sponder G, Vormann J, Aschenbach JR, Kolisek M. Insulin modulates the Na+/Mg2+ exchanger SLC41A1 and influences Mg2+ efflux from intracellular stores in transgenic HEK293 Cells. J Nutr. 2015; 145:2440-7. https://doi.org/10.3945/jn.115.213918.
14. Delva P, Degan M, Trettene M, Lechi A. Insulin and glucose mediate opposite intracellular ionized magnesium variations in human lymphocytes. J Endocrinol. 2006; 190:711-8. https://doi.org/10.1677/joe.1.06389.
15. Touyz RM, Yao G. Up-regulation of vascular and renal mitogen-activated protein kinases in hypertensive rats is normalized by inhibitors of the Na+/Mg2+ exchanger. Clin Sci (Lond). 2003; 105:235-42. https://doi.org/10.1042/CS20030033.
16. Yao JJ, Gao XF, Chow CW, Zhan XQ, Hu CL, Mei YA. Neuritin activates insulin receptor pathway to up-regulate Kv4.2-mediated transient outward K+ current in rat cerebellar granule neurons. J Biol Chem. 2014; 287:41534-45. https://doi.org/10.1074/jbc.M112.390260.
17. Razmara M, Heldin CH, Lennartsson J. Platelet-derived growth factor-induced Akt phosphorylation requires mTOR/Rictor and phospholipase C-γ1, whereas S6 phosphorylation depends on mTOR/Raptor and phospholipase D. Cell Commun Signal. 2013; 11:3. https://doi.org/10.1186/1478-811X-11-3.
18. Xu Z, Zhang Y, Jiang J, Yang Y, Shi R, Hao B, Zhang Z, Huang Z, Kim JW, Zhang G. Epidermal growth factor induces HCCR expression via PI3K/Akt/mTOR signaling in PANC-1 pancreatic cancer cells. BMC Cancer. 2010; 10:161. https://doi.org/10.1186/1471-2407-10-161.
19. Tao Y, Pinzi V, Bourhis J, Deutsch E. Mechanisms of disease: signaling of the insulin-like growth factor 1 receptor pathway: therapeutic perspectives in cancer. Nat Clin Pract Oncol. 2007; 4:591-602. https://doi.org/10.1038/ncponc0934.
20. Park HK, Ahima RS. Leptin signaling. F1000Prime Rep. 2014; 6:73. https://doi.org/10.12703/P6-73.
21. Gu F, Dubé N, Kim JW, Cheng A, Ibarra-Sanchez Mde J, Tremblay ML, Boisclair YR. Protein tyrosine phosphatase 1B attenuates growth hormone-mediated JAK2-STAT signaling. Mol Cell Biol. 2003; 23:3753-62. https://doi.org/10.1128/MCB.23.11.3753-3762.2003.
22. Argetsinger LS, Hsu GW, Myers MG Jr, Billestrup N, White MF, Carter-Su C. Growth hormone, interferon-gamma, and leukemia inhibitory factor promoted tyrosyl phosphorylation of insulin receptor substrate-1. J Biol Chem. 1995; 270:14685-92. https://doi.org/10.1074/jbc.270.24.14685.
23. Mitra SK, Schlaepfer DD. Integrin-regulated FAK-Src signaling in normal and cancer cells. Curr Opin Cell Biol. 2006; 18:516-23. https://doi.org/10.1016/j.ceb.2006.08.011.
24. Romanuik TL, Wang G, Holt RA, Jones SJ, Marra MA, Sadar MD. Identification of novel androgen-responsive genes by sequencing of LongSAGE libraries. BMC Genomics. 2009; 10:476. https://doi.org/10.1186/1471-2164-10-476.
25. Myung JK, Banuelos CA, Fernandez JG, Mawji NR, Wang J, Tien AH, Yang YC, Tavakoli I, Haile S, Watt K, McEwan IJ, Plymate S, Andersen RJ, Sadar MD. An androgen receptor N-terminal domain antagonist for treating prostate cancer. J Clin Invest. 2013; 123:2948-60. https://doi.org/10.1172/JCI66398.
26. Fang Y, Li G, Ferrie AM. Non-invasive optical biosensor for assaying endogenous G protein-coupled receptors in adherent cells. J Pharmacol Toxicol Methods. 2007; 55:314-22. https://doi.org/10.1016/j.vascn.2006.11.001.
27. Smyth SS, Woulfe DS, Weitz JI, Gachet C, Conley PB, Goodman SG, Roe MT, Kuliopulos A, Moliterno DJ, French PA, Steinhubl SR, Becker RC. G-protein-coupled receptors as signaling targets for antiplatelet therapy. Arterioscler Thromb Vasc Biol. 2009; 29:449-57. https://doi.org/10.1161/ATVBAHA.108.176388.
28. Matsoukas J, Hollenberg MD, Mavromoustakos T, Panagiotopoulos D, Alexopoulos K, Yamdagni R, Wu Q, Moore GJ. Conformational analysis of the thrombin receptor agonist peptides SFLLR and SFLLR-NH2 by NMR: evidence for a cyclic bioactive conformation. J Protein Chem. 1997; 16:113-31.
29. Fang Y, Ferrie AM. Optical biosensor differentiates signaling of endogenous PAR1 and PAR2 in A431 cells. BMC Cell Biol. 2007; 8:24. https://doi.org/10.1186/1471-2121-8-24.
30. Paxton R, Ye L. Regulation of heart insulin receptor tyrosine kinase activity by magnesium and spermine. Mol Cell Biochem. 2005; 277:7-17. https://doi.org/10.1007/s11010-005-5755-4.
31. Pozuelo-Rubio M, Leslie NR, Murphy J, MacKintosh C. Mechanism of activation of PKB/Akt by the protein phosphatase inhibitor calyculin A. Cell Biochem Biophys. 2010; 58:147-56. https://doi.org/10.1007/s12013-010-9101-4.
32. Touyz RM, Mercure C, Reudelhuber TL. Angiotensin II type I receptor modulates intracellular free Mg2+ in renally derived cells via Na+-dependent Ca2+-independent mechanisms. J Biol Chem. 2001; 276:13657-63. https://doi.org/10.1074/jbc.M008101200.
33. Thekkumkara TJ, Du J, Zwaagstra C, Conrad KM, Krupinski J, Baker KM. A role for cAMP in angiotensin II mediated inhibition of cell growth in AT1A receptor-transfected CHO-K1 cells. Mol Cell Biochem. 1995; 152:77-86. https://doi.org/10.1007/BF01076466.
34. Goytain A, Quamme GA. Functional characterization of human SLC41A1, a Mg2+ transporter with similarity to prokaryotic MgtE Mg2+ transporters. Physiol Genomics. 2005; 21:337-42. https://doi.org/10.1152/physiolgenomics.00261.2004.
35. Alessi DR, Andjelkovic M, Caudwell B, Cron P, Morrice N, Cohen P, Hemmings BA. Mechanism of activation of protein kinase B by insulin and IGF-1. EMBO J. 1996; 15:6541-51.
36. Song G, Ouyang G, Bao S. The activation of Akt/PKB signaling pathway and cell survival. J Cell Mol Med. 2005; 9:59-71. https://doi.org/10.1111/j.1582-4934.2005.tb00337.xView.
37. Krueger RC Jr, Santore MT, Dawson G, Schwartz NB. Increased extracellular magnesium modulates proliferation in fetal neural cells in culture. Brain Res Dev Brain Res. 2001; 127:99-109. https://doi.org/10.1016/S0165-3806(01)00105-5.
38. Lee PY, Yang CH, Kao MC, Su NY, Tsai PS, Huang CJ. Phosphoinositide 3-kinase β, phosphoinositide 3-kinase δ, and phosphoinositide 3-kinase γ mediate the anti-inflammatory effects of magnesium sulfate. J Surg Res. 2015; 197:390-7. https://doi.org/10.1016/j.jss.2015.04.051.
39. Dangelmaier C, Manne BK, Liverani E, Jin J, Bray P, Kunapuli SP. PDK1 selectively phosphorylates Thr(308) on Akt and contributes to human platelet functional responses. Thromb Haemost. 2014; 111:508-17. https://doi.org/10.1160/TH13-06-0484.
40. Bayascas JR, Alessi DR. Regulation of Akt/PKB Ser473 phosphorylation. Mol Cell. 2005; 18:143-5. https://doi.org/10.1016/j.molcel.2005.03.020.
41. Sarbassov DD, Guertin DA, Ali SM, Sabatini DM. Phosphorylation and regulation of Akt/PKB by the rictor-mTOR complex. Science. 2005; 307:1098-101. https://doi.org/10.1126/science.1106148.
42. Tsuchiya A, Kanno T, Nishizaki T. PI3 kinase directly phosphorylates Akt1/2 at Ser473/474 in the insulin signal transduction pathway. J Endocrinol. 2013; 220:49-59. https://doi.org/10.1530/JOE-13-0172.
43. Kuo YC, Huang KY, Yang CH, Yang YS, Lee WY, Chiang CW. Regulation of phosphorylation of Thr-308 of Akt, cell proliferation, and survival by the B55alpha regulatory subunit targeting of the protein phosphatase 2A holoenzyme to Akt. J Biol Chem. 2008; 283:1882-92. https://doi.org/10.1074/jbc.M709585200.
44. Gao T, Furnari F, Newton AC. PHLPP: a phosphatase that directly dephosphorylates Akt, promotes apoptosis, and suppresses tumor growth. Mol Cell. 2005; 18:13-24. https://doi.org/10.1016/j.molcel.2005.03.008.
45. Guo F, Stanevich V, Wlodarchak N, Sengupta R, Jiang L, Satyshur KA, Xing Y. Structural basis of PP2A activation by PTPA, an ATP-dependent activation chaperone. Cell Res. 2014; 24:190-203. https://doi.org/10.1038/cr.2013.138.
46. Northcott CA, Watts SW. Low [Mg2+]e enhances arterial spontaneous tone via phosphatidylinositol 3-kinase in DOCA-salt hypertension. Hypertension. 2004; 43:125-9. https://doi.org/10.1161/01.HYP.0000103631.68328.03.
47. Sponder G, Mastrototaro L, Kurth K, Merolle L, Zhang Z, Abdulhanan N, Smorodchenko A, Wolf K, Fleig A, Penner R, Iotti S, Aschenbach JR, Vormann J, Kolisek M. Human CNNM2 is not a Mg2+ transporter per se. Pflugers Arch. 2016; 468:1223-40. https://doi.org/10.1007/s00424-016-1816-7.
48. Kraus I, Besong Agbo D, Otto M, Wiltfang J, Klafki H. Detection and differentiation of threonine- and tyrosine-monophosphorylated forms of ERK1/2 by capillary isoelectric focusing-immunoassay. Sci Rep. 2015; 5:12767. https://doi.org/10.1038/srep12767.
49. Roskoski R Jr. ERK1/2 MAP kinases: structure, function, and regulation. Pharmacol Res. 2012; 66:105-43. https://doi.org/10.1016/j.phrs.2012.04.005.
50. Mebratu Y, Tesfaigzi Y. How ERK1/2 activation controls cell proliferation and cell death: is subcellular localization the answer? Cell Cycle. 2009; 8:1168-75. https://doi.org/10.4161/cc.8.8.8147.
51. Mendoza MC, Er EE, Blenis J. The Ras-ERK and PI3K-mTOR pathways: cross-talk and compensation. Trends Biochem Sci. 2011; 36:320-8. https://doi.org/10.1016/j.tibs.2011.03.006.
52. Inoki K, Li Y, Zhu T, Wu J, Guan KL. TSC2 is phosphorylated and inhibited by Akt and suppresses mTOR signalling. Nat Cell Biol. 2002; 4:648-57. https://doi.org/10.1038/ncb839.
53. Huang B, Porter G. Expression of proline-rich Akt-substrate PRAS40 in cell survival pathway and carcinogenesis. Acta Pharmacol Sin. 2005; 26:1253-8. https://doi.org/10.1111/j.1745-7254.2005.00184.x.
54. Chiarini F, Evangelisti C, McCubrey JA, Martelli AM. Current treatment strategies for inhibiting mTOR in cancer. Trends Pharmacol Sci. 2015; 36:124-35. https://doi.org/10.1016/j.tips.2014.11.004.
55. Rubin H. The membrane, magnesium, mitosis (MMM) model of cell proliferation control. Magnes Res. 2005; 18:268-74.
56. Mazhab-Jafari MT, Marshall CB, Ishiyama N, Ho J, Di Palma V, Stambolic V, Ikura M. An autoinhibited noncanonical mechanism of GTP hydrolysis by Rheb maintains mTORC1 homeostasis. Structure. 2012; 20:1528-39. https://doi.org/10.1016/j.str.2012.06.013.
57. Yu Y, Li S, Xu X, Li Y, Guan K, Arnold E, Ding J. Structural basis for the unique biological function of small GTPase RHEB. J Biol Chem. 2005; 280:17093-100. https://doi.org/10.1074/jbc.M501253200.
58. Bar-Peled L, Schweitzer LD, Zoncu R, Sabatini DM. Ragulator is a GEF for the rag GTPases that signal amino acid levels to mTORC1. Cell. 2012; 150:1196-208. https://doi.org/10.1016/j.cell.2012.07.032.
59. Mackenzie RW, Elliot BT. Akt/PKB activation and insulin signaling: a novel insulin signaling pathway in the treatment of type 2 diabetes. Diabetes Metab Syndr Obes. 2014; 7:55-64. https://doi.org/10.2147/DMSO.S48260.
60. Dineley KT, Jahrling JB, Denner L. Insulin resistance in Alzheimer’s disease. Neurobiol Dis. 2014; 72PA:92-103. https://doi.org/10.1016/j.nbd.2014.09.001.
61. Altomare DA, Testa JR. Perturbations of the AKT signaling pathway in human cancer. Oncogene. 2005; 24:7455-64. https://doi.org/10.1038/sj.onc.1209085.
62. Park S, Chapuis N, Tamburini J, Bardet V, Cornillet-Lefebvre P, Willems L, Green A, Mayeux P, Lacombe C, Bouscary D. Role of the PI3K/AKT and mTOR signaling pathways in acute myeloid leukemia. Haematologica. 2010; 95:819-28. https://doi.org/10.3324/haematol.2009.013797.
63. Chin YR, Toker A. Function of Akt/PKB signaling to cell motility, invasion and the tumor stroma in cancer. Cell Signal. 2009; 21:470-6. https://doi.org/10.1016/j.cellsig.2008.11.015.
64. Wolf FI, Cittadini A. Magnesium in cell proliferation and differentiation. Front Biosci. 1999; 4:D607-17.
65. Kim YB, Kotani K, Ciaraldi TP, Henry RR, Kahn BB. Insulin-stimulated protein kinase C λ/ζ activity is reduced in skeletal muscle of humans with obesity and type 2 diabetes. Diabetes. 2003; 52:1935-42. https://doi.org/10.2337/diabetes.52.8.1935.
66. Rivera A, Ferreira A, Bertoni D, Romero JR, Brugnara C. Abnormal regulation of Mg2+ transport via Na/Mg exchanger in sickle erythrocytes. Blood. 2005; 105:382-386. https://doi.org/10.1182/blood-2003-11-3755.
67. Litan A, Langhans SA. Cancer as a channelopathy: ion channels and pumps in tumor development and progression. Front Cell Neurosci. 2015; 9:86. https://doi.org/10.3389/fncel.2015.00086.
68. Gilda JE, Gomes AV. Stain-Free total protein staining is a superior loading control to beta-actin for Western blots. Anal Biochem. 2013; 440:186-8.
69. Gilda JE, Gomes AV. Western blotting using in-gel protein labeling as a normalization control: stain-free technology. Methods Mol Biol. 2015; 1295:381-91.
70. Braun HS, Sponder G, Pieper R, Aschenbach JR, Deiner C. GABA selectively increases mucin-1 expression in isolated pig jejunum. Genes Nutr. 2015; 10:47. https://doi.org/10.1007/s12263-015-0497-8.