
INTRODUCTION
Lung cancer is the leading cause of cancer related death worldwide [1] and adenocarcinoma (AC) is the most common histological type [2]. The TNM staging system is often used to determine how far the cancer has spread based on the size of the primary tumor, lymph nodes spread and metastasis [3]. Although survival of pathologic stage IA patients is expected to be much better than those at other stages, 5-year survival of these patients varies from 77% to 94.4% [4]. Stage IA patients often have very different outcomes even if undergoing the same treatment. We and others have previously reported that the new International Association for the Study of Lung Cancer/American Thoracic Society/European Respiratory Society (IASLC/ATS/ERS) lung AC classification [5] is significantly associated with patient survival, confirming the prognostic value of the new classification system [4, 6, 7]. With the recent advances of genome-wide sequencing and gene expression profiling, we have gained a deeper understanding of cancers on a molecular level. Multiple studies involving gene expression profiling of lung cancers suggest that gene expression signatures in addition to the IASLC/ATS/ERS system can be used to improve the prediction of patient survival [8–11]. In this study, we focus on identifying molecular prognostic markers that can predict the survival of stage IA lung adenocarcinoma patients, with the intention of finding reliable prognostic markers for better management and treatment of stage IA lung adenocarcinoma.
RESULTS
Differentially expressed genes in acinar and solid subtype lung AC
To identify molecular prognostic markers for stage IA lung AC, we decided to analyze the gene expression profiles of lung AC from different clinicopathological subgroups. Using tissue micro-dissection, we were able to capture at least 500 tumor cells from each patient specimen. 4 acinar subtype lung AC, which has a better prognosis, and 4 solid subtype lung AC, which has a worse prognosis, were selected for comparison of gene expression profiles using Affymetrix PrimView microarrays. Representative images of solid and acinar subtype lung AC are presented in Figure 1. Clinical information of the patients enrolled in this study such as age, clinicopathological subtype, disease-free survival (DFS) and overall survival (OS) can be found in Table 1 and Supplementary Table 1. Using a cutoff value of fold change > 2 and a p-value < 0.05, 521 genes were upregulated and 534 genes were downregulated in acinar subtype lung AC compared to solid subtype (Figure 2A). The heatmap of differentially expressed genes shows a clear distinction between acinar and solid subtype lung AC (Figure 2B).
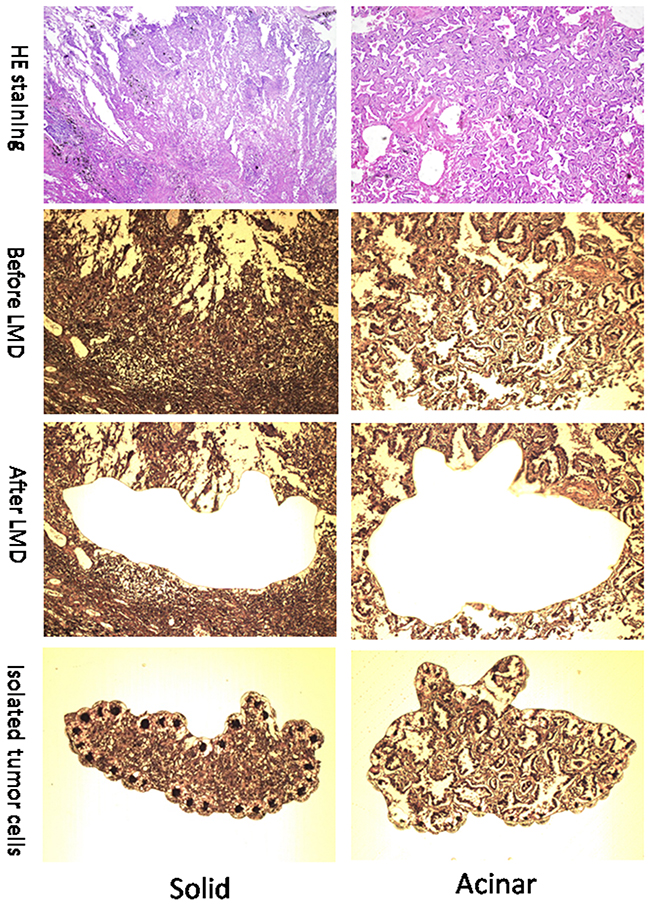
Figure 1: Representative images (100x) of solid and acinar subtypes of Lung AC. Images in the top row show HE staining of solid (left) and acinar (right) AC. Images in the 2nd row show solid (left) and acinar (right) lung tumor sections before laser microdissection (LMD). Images in the bottom two rows show sections with tumor tissues removed (3rd row) and tumor fractions that were dissected out (4th row).
Table 1: Clinical information of pathological stage IA lung AC patients
Patient ID |
Histological subtype |
Gender |
Age |
DFS (months) |
OS (months) |
|---|---|---|---|---|---|
12-6305 |
Acinar |
Male |
43 |
46 |
46 |
12-3960 |
Acinar |
Female |
55 |
50 |
50 |
12-406 |
Acinar |
Female |
61 |
54 |
54 |
12-5316 |
Acinar |
Female |
52 |
48 |
48 |
12-6242 |
Solid |
Male |
59 |
10 |
40 |
12-3765 |
Solid |
Male |
62 |
34 |
50 |
12-1427 |
Solid |
Female |
59 |
53 |
53 |
12-6734 |
Solid |
Female |
60 |
45 |
45 |
DFS, disease free survival; OS, overall survival.
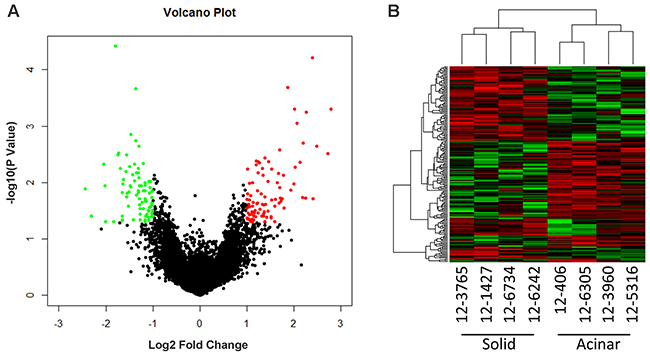
Figure 2: Microarray gene expression profiling of acinar and solid subtype of Lung AC. (A) Volcano plot shows differentially expressed genes comparing acinar and solid subtype of Lung AC. Red dots highlight genes overexpressed in acinar subtype (fold change > 2, p value < 0.05). Green dots highlight genes underexpressed in acinar subtype (fold change > 2, p value < 0.05). (B) Heatmap shows differentially expressed genes in acinar subtype samples (12-406, 12-6305, 12-3960, 12-5316) and solid subtype samples (12-3765, 12-1427, 12-6734, 12-6242).
Pathways and gene set enrichment analysis in acinar and solid subtype lung AC
Aberrations in key pathways are common in lung AC [12]. We thus used Gene Set Enrichment Analysis (GSEA) [13, 14] to identify key pathways and gene sets that are altered in acinar and solid subtypes of lung AC. 1174 gene sets were upregulated in acinar subtype, among which 9 gene sets were significant at false discovery rate (FDR) < 0.25 and 40 gene sets were significantly enriched at a nominal p-value < 0.01. 2691 gene sets were upregulated in solid subtype, among which 84 gene sets were significantly enriched at FDR < 0.25 and 114 gene sets were significantly enriched at a nominal p-value < 0.01. The top 9 enriched gene sets based on their normalized enriched score (NES) are shown for acinar subtype and solid subtype in Tables 2 and 3, respectively. Notably, the gene set that is involved in RNA polymerase I transcriptional activity is among the top gene sets enriched in solid subtype lung AC (Figure 3). Dysregulated RNA polymerase I activity is commonly associated with upregulated cell growth such as cancer [15, 16], indicating that poor prognosis of solid subtype lung AC may be due to aberrant activation of RNA polymerase I activity. Interestingly, p53 target genes were downregulated in solid subtype lung AC (Figure 3). The p53 pathway has been shown to regulate RNA polymerase I activity by repressing rRNA genes [17, 18], suggesting that dysregulated RNA polymerase I activity may be due to inactivation of the p53 pathway in solid subtype lung AC.
Table 2: Top 9 gene sets enriched in acinar subtype lung AC
NAME |
SIZE |
ES |
NES |
NOM p-val |
FDR q-val |
|---|---|---|---|---|---|
REACTOME_CREB_PHOSPHORYLATION_THROUGH_THE_ACTIVATION_OF_RAS |
27 |
0.59 |
1.95 |
0 |
0.07 |
LEIN_ASTROCYTE_MARKERS |
42 |
0.52 |
1.81 |
0 |
0.26 |
REACTOME_INWARDLY_RECTIFYING_K_CHANNELS |
30 |
0.57 |
1.81 |
0 |
0.19 |
REACTOME_POST_NMDA_RECEPTOR_ACTIVATION_EVENTS |
33 |
0.48 |
1.77 |
0 |
0.23 |
REACTOME_GABA_B_RECEPTOR_ACTIVATION |
37 |
0.49 |
1.73 |
0 |
0.29 |
BILANGES_SERUM_SENSITIVE_VIA_TSC1 |
23 |
0.53 |
1.73 |
0 |
0.25 |
TANG_SENESCENCE_TP53_TARGETS_UP |
33 |
0.54 |
1.73 |
0 |
0.22 |
REACTOME_INHIBITION_OF_INSULIN_SECRETION_BY_ADRENALINE_NORADRENALINE |
24 |
0.55 |
1.73 |
0 |
0.20 |
REACTOME_RAS_ACTIVATION_UOPN_CA2_INFUX_THROUGH_NMDA_RECEPTOR |
17 |
0.62 |
1.71 |
0 |
0.22 |
ES, enrichment sore; NES, normalized enrichment score; NOM p-value, nominal p value; FDR q-val, false discovery rate q value.
Table 3: Top 9 gene sets enriched in solid subtype lung AC
NAME |
SIZE |
ES |
NES |
NOM p-val |
FDR q-val |
|---|---|---|---|---|---|
REACTOME_TELOMERE_MAINTENANCE |
75 |
-0.59 |
-1.95 |
0 |
0.16 |
REACTOME_RNA_POL_I_TRANSCRIPTION |
82 |
-0.62 |
-1.93 |
0 |
0.13 |
REACTOME_RNA_POL_I_RNA_POL_III_AND_MITOCHONDRIAL_TRANSCRIPTION |
114 |
-0.55 |
-1.92 |
0 |
0.11 |
REACTOME_PACKAGING_OF_TELOMERE_ENDS |
48 |
-0.66 |
-1.89 |
0 |
0.13 |
DELPUECH_FOXO3_TARGETS_DN |
40 |
-0.57 |
-1.88 |
0 |
0.11 |
KEGG_FRUCTOSE_AND_MANNOSE_METABOLISM |
34 |
-0.51 |
-1.86 |
0 |
0.13 |
REACTOME_MEIOTIC_RECOMBINATION |
81 |
-0.59 |
-1.85 |
0 |
0.12 |
REACTOME_RNA_POL_I_PROMOTER_OPENING |
58 |
-0.66 |
-1.82 |
0 |
0.14 |
GALINDO_IMMUNE_RESPONSE_TO_ENTEROTOXIN |
82 |
-0.49 |
-1.81 |
0 |
0.15 |
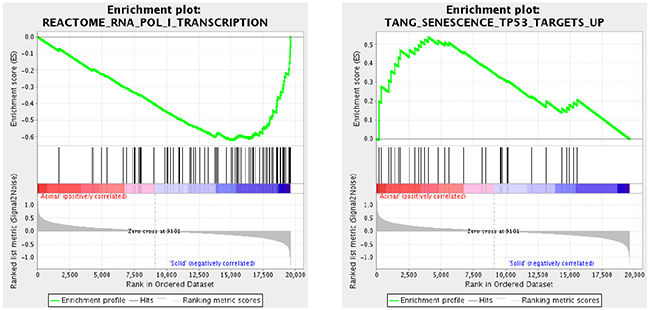
Figure 3: Cancer related signaling pathways are altered in different subtypes of lung AC. Gene Set Enrichment Analysis (GSEA) was used to identify dysregulated signaling pathways in acinar and solid subtype of lung AC samples. Among the top dysregulated gene sets, we found enriched RNA polymerase I transcriptional activity, a common feature in human cancers, in solid subtype lung AC. Interestingly, the p53 pathway, which often regulates RNA polymerase I activity, is down-regulated in solid subtype lung AC, indicating that a worse prognosis in solid subtype lung AC is potentially due to inactivation of p53 target genes, which leads to dysregulated RNA polymerase I transcription.
Candidate genes show prognostic value in lung AC TCGA datasets
To evaluate if the identified prognostic markers are valuable in predicting patient survival, we focused on the top 50 differentially expressed genes between acinar and solid subtype lung AC (Figure 4). We then utilized OncoLnc [19], a tool developed for conveniently exploring survival correlations with gene expression data from 21 cancer studies performed by The Cancer Genome Atlas (TCGA). 11 genes that are overexpressed in acinar subtype lung AC show a positive correlation with patient survival. Patients with higher expression of these genes have favorable overall survival (p-value < 0.05) (Figure 5). 5 genes that are overexpressed in solid subtype lung AC show a negative correlation with patient survival. Patients with higher expression of these genes have worse overall survival (p-value < 0.05) (Figure 6).
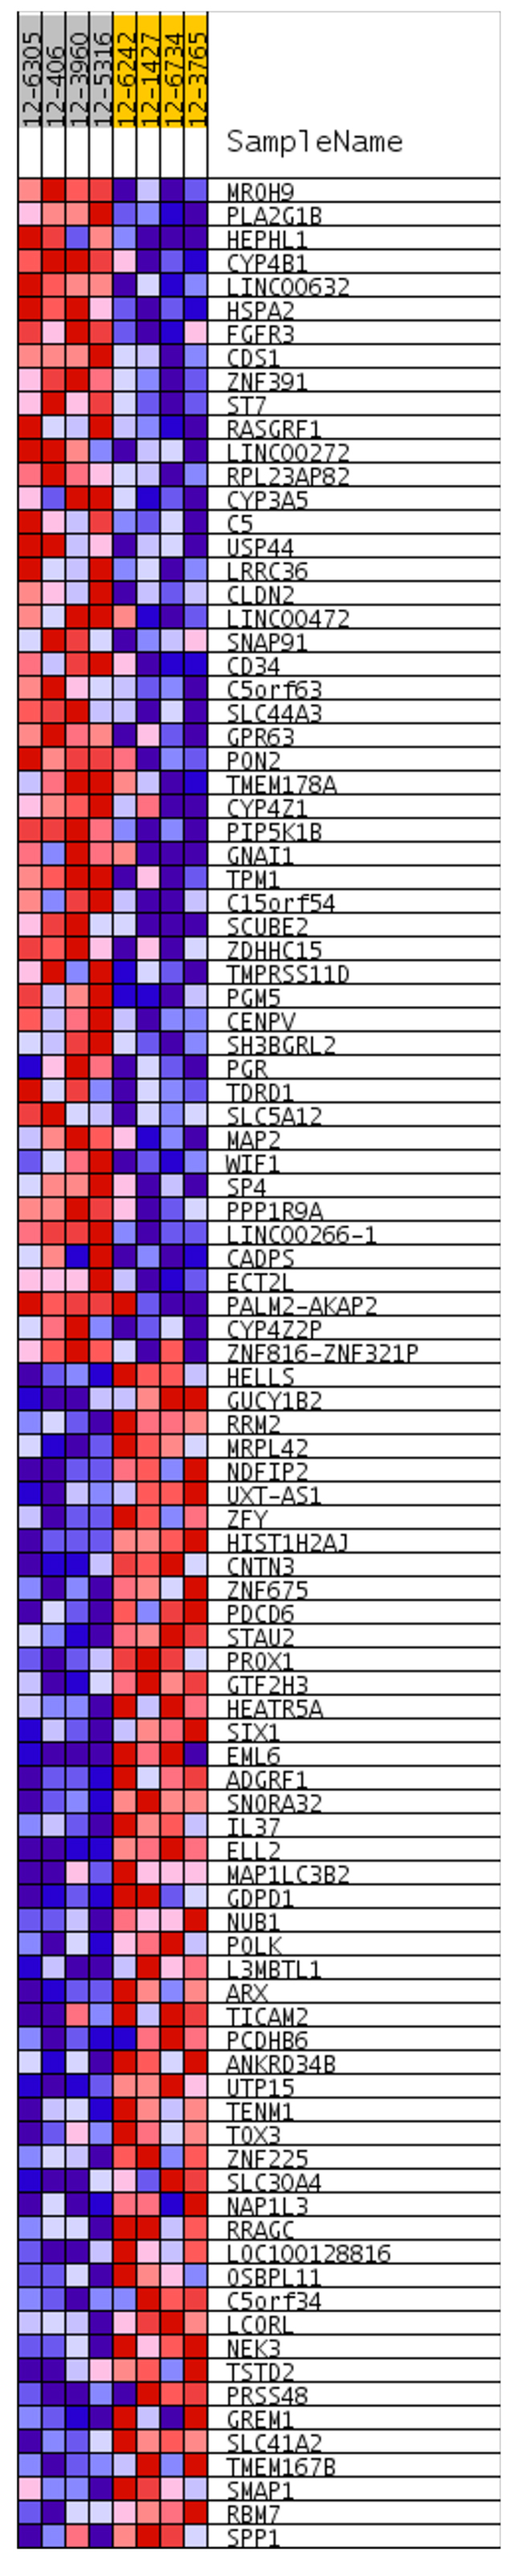
Figure 4: Heatmap shows top 50 differentially expressed genes between acinar and solid subtypes of lung AC. Red indicates overexpression and blue indicates underexpression. Heatmap was generated in GSEA.
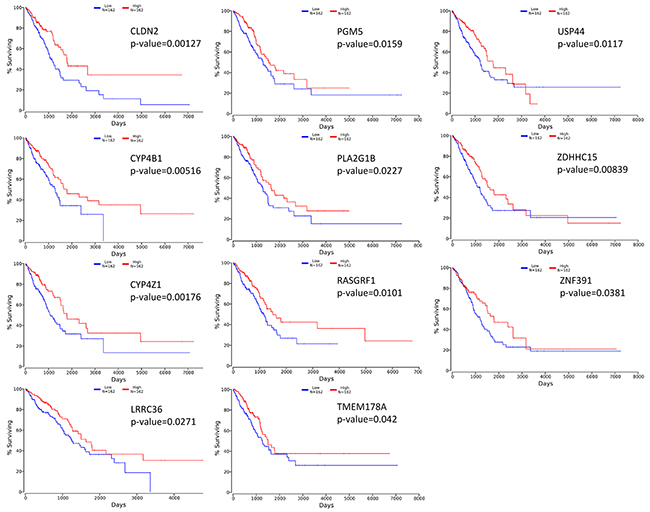
Figure 5: Kaplan-Meier survival curves using TCGA data validate the prognostic value of genes overexpressed in acinar subtype lung AC.
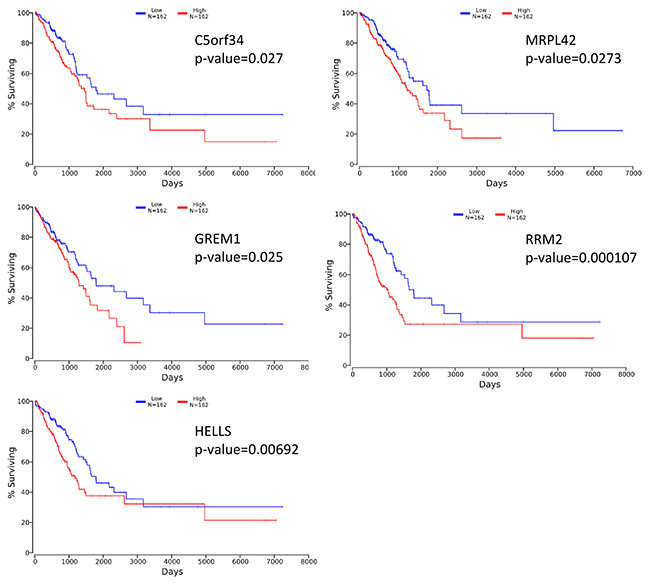
Figure 6: Kaplan-Meier survival curves using TCGA data validate the prognostic value of genes overexpressed in solid subtype lung AC.
Together, our data suggest that acinar and solid subtypes of lung AC have distinct gene expression signatures. The poor prognosis of solid subtype lung AC is potentially due to dysregulated RNA polymerase I activity and inactivation of the p53 pathway. Candidate prognostic marker genes from our study may be valuable for prediction of patient survival and guidance for disease management and treatment.
DISCUSSION
Stage IA lung adenocarcinoma is a very heterogeneous disease. Previous studies have shown a wide range of 5-year survival and outcome from treatments for stage IA lung AC patients [20–22]. The new multidisciplinary IASLC/ATS/ERS lung AC classification system has improved the prediction of patient survival [4, 6, 7]. With the recent advances in genomics, gene expression profiling has been shown to predict the survival of patients with lung cancer accurately [23–26]. Moreover, molecular profiling may help predict patient response to treatments [27]. Several recent studies have identified gene expression signatures in non-small cell lung cancers, including lung AC, that predict patient survival. In our study, we focused on stage IA lung AC and specifically compared the gene expression signatures of specimens from 8 acinar and solid subtype lung AC patients. We identified genes that are positively correlated with survival (CLDN2, PGM5, USP44, CYP4B1, PLA2G1B, ZDHHC15, CYP4Z1, RASGRF1, ZNF391, LRRC36, TMEM178A) and negatively correlated with survival (C5orf34, MRPL42, GREM1, RRM2, HELLS). In addition, we identified gene sets and pathways that are differentially activated in acinar and solid subtype lung AC that may help predict response to treatments.
The identified genes that predict survival of stage IA lung AC patients may reveal important information for developing subtype specific therapies. CLDN2 encodes for Claudin-2, which belongs to major integral membrane proteins localized in tight junctions. CLDN2 was previously shown to be a good prognostic factor in non-small cell lung cancer [28]. PGM5 is a phosphoglucomutase involved in interconversion of glucose-1-phosphate and glucose-6-phosphage [29]. PGM5 has been found to be down-regulated in colorectal cancers [30]. USP44 is a deubiquitinase that functions as a key regulator of mitotic spindle checkpoint and loss of Usp44 in mice resulted in spontaneous tumor development, especially in lung [31]. USP44 is also frequently downregulated in human lung cancers and its decreased expression is associated with a poor prognosis [31]. CYP4B1 and CYP4Z1 are members of the cytochrome P450 monooxygenase involved in drug metabolism. It has been reported that the expression of CYP4B1 is reduced in neoplastic lung tissues compared with normal lung [32]. Mutations of the CYP4Z1 gene have been associated with progression of NSCLC [33]. GREM1 is a bone morphogenic protein (BMP) antagonist. It is overexpressed in lung AC and forced expression increases proliferation in normal lung cells [34]. RRM2 is ribonucleotide reductase regulatory subunit M2, which catalyzes the formation of deoxyribonucleotides from ribonucleotides. Multiple studies have suggested that high expression of RRM2 correlates with poor prognosis in NSCLC patients [35, 36].
In conclusion, our gene expression analysis on different subtypes of stage IA lung AC have revealed valuable prognostic factors that may help improve the prediction of patient survival. Furthermore, it may provide important implications for identifying targeted therapies in a subtype specific manner. Due to the relatively small sample size in this study, follow-up studies with a larger cohort of patient specimens will strengthen our discovery and hopefully help further improve the clinical outcomes of patients.
MATERIALS AND METHODS
Patient information
We used data from the records of 8 patients with pathological stage IA AC, who had undergone a lobectomy and mediastinal lymph node dissection at Shanghai Chest Hospital, Shanghai, China in 2012. Written consent was obtained from all participants and our ethics committee approved this study. None of the subjects had received radiation therapy or chemotherapy prior to surgery. Smoking history was obtained from the patients via interview. Regular follow-up evaluations after surgery for all patients included physical examination, blood examination, computed tomography scan of the chest and abdomen, brain magnetic resonance imaging, and bone scanning. Postoperative follow-up involved examination every 3 months for 2 years, every 6 months for years 3-5, and every 12 months from year 5. The median follow-up time for the entire group was 70 months (range, 10-150 months). All cases were confirmed by retrospective pathological analysis of paraffin-embedded sections.
Microarray
At least 500 tumor cells were micro-dissected from each patient specimen. All samples were submitted to the WuXi Genome Center for microarray analysis. RNA extraction was performed followed by QC. Samples were then processed for microarray expression analysis using PrimeView Human Gene Expression Array (Thermo Fisher Scientific). Data QC was processed using Affymetrix Expression Console software (version 1.3.1). Microarray data was processed using R with the limma package. RMA normalization was applied.
GSEA analysis
GSEA is a computational methodology to identify classes of genes that are overexpressed in a large set of genes between two biological states, such as disease phenotypes [13, 14]. This analysis was done using GenePattern (https://genepattern.broadinstitute.org/). The Molecular Signatures Database (MSigDB) C2 collection, consisting of canonical pathways and experimental signatures curated from publications, was used for the analysis.
Survival correlation
OncoLnc (www.oncolnc.org) is a web-based database for exploring correlations between gene expression and cancer patient survival. It contains survival data for 8,647 patients from 21 cancer studies performed by The Cancer Genome Atlas (TCGA), along with RNA-SEQ expression for mRNAs and miRNAs from TCGA [19]. OncoLnc was used to link TCGA survival data to microarray gene expression data [19]. A 33% upper percentile and 33% lower percentile of expression was used to generate a Kaplan-Meier survival curve for individual genes of interest.
Statistical analysis
For microarray analysis, the significance of differential gene expression is determined by a cut-off of p-value < 0.05 and fold change > 2. Statistics used in GSEA analysis was previously described [13]. Significance of enriched gene sets is determined by a cut-off of FDR < 0.25 and nominal p-value < 0.01. For OncoLnc, multivariate Cox regressions were used to conduct survival analysis [19] and a p-value < 0.05 is considered significant.
Abbreviations
AC: adenocarcinoma; GSEA: gene set enrichment analysis; DFS: disease free survival; OS: overall survival; TCGA: the cancer genome atlas; NES: normalized enriched score; IASLC/ATS/ERS: International Association for the Study of Lung Cancer/American Thoracic Society/European Respiratory Society; FDR: false discovery rate.
Author contributions
J.Z., B. H., and K.Y. designed research, J.S., L.Z., R.Z., J.X., J.W., X.G., and K.Y. performed experiments. J.Z., J.W., X.G., S.T., and K.Y. analyzed data; J.Z., J.W., S.T., and K.Y. wrote the paper.
CONFLICTS OF INTEREST
No potential conflicts of interests exist.
FUNDING
This work was supported by the Major and Key Foundation of Shanghai Chest Hospital (grant no. 2014YZDC10200).
REFERENCES
1. Greenlee RT, Hill-Harmon MB, Murray T, Thun M. Cancer statistics, 2001. CA Cancer J Clin. 2001; 51:15-36.
2. Devesa SS, Bray F, Vizcaino AP, Parkin DM. International lung cancer trends by histologic type: male:female differences diminishing and adenocarcinoma rates rising. Int J Cancer. 2005; 117:294-299.
3. Rami-Porta R, Asamura H, Travis WD, Rusch VW. Lung cancer - major changes in the American Joint Committee on Cancer eighth edition cancer staging manual. CA Cancer J Clin. 2017; 67:138-155.
4. Guan JL, Zhong WZ, An SJ, Yang JJ, Su J, Chen ZH, Yan HH, Chen ZY, Huang ZM, Zhang XC, Nie Q, Wu YL. KRAS mutation in patients with lung cancer: a predictor for poor prognosis but not for EGFR-TKIs or chemotherapy. Ann Surg Oncol. 2013; 20:1381-1388.
5. Travis WD, Brambilla E, Noguchi M, Nicholson AG, Geisinger KR, Yatabe Y, Beer DG, Powell CA, Riely GJ, Van Schil PE, Garg K, Austin JH, Asamura H, et al. International association for the study of lung cancer/american thoracic society/european respiratory society international multidisciplinary classification of lung adenocarcinoma. J Thorac Oncol. 2011; 6:244-285.
6. Yoshizawa A, Motoi N, Riely GJ, Sima CS, Gerald WL, Kris MG, Park BJ, Rusch VW, Travis WD. Impact of proposed IASLC/ATS/ERS classification of lung adenocarcinoma: prognostic subgroups and implications for further revision of staging based on analysis of 514 stage I cases. Mod Pathol. 2011; 24:653-664.
7. Zhang J, Wu J, Tan Q, Zhu L, Gao W. Why do pathological stage IA lung adenocarcinomas vary from prognosis?: a clinicopathologic study of 176 patients with pathological stage IA lung adenocarcinoma based on the IASLC/ATS/ERS classification. J Thorac Oncol. 2013; 8:1196-202.
8. Sun Y, Hou L, Yang Y, Xie H, Yang Y, Li Z, Zhao H, Gao W, Su B. Two-gene signature improves the discriminatory power of IASLC/ATS/ERS classification to predict the survival of patients with early-stage lung adenocarcinoma. Onco Targets Ther. 2016; 9:4583-4591.
9. Kratz JR, He J, Van Den Eeden SK, Zhu ZH, Gao W, Pham PT, Mulvihill MS, Ziaei F, Zhang H, Su B, Zhi X, Quesenberry CP, Habel LA, et al. A practical molecular assay to predict survival in resected non-squamous, non-small-cell lung cancer: development and international validation studies. Lancet. 2012; 379:823-832.
10. Raz DJ, Ray MR, Kim JY, He B, Taron M, Skrzypski M, Segal M, Gandara DR, Rosell R, Jablons DM. A multigene assay is prognostic of survival in patients with early-stage lung adenocarcinoma. Clin Cancer Res. 2008; 14:5565-5570.
11. Chen HY, Yu SL, Chen CH, Chang GC, Chen CY, Yuan A, Cheng CL, Wang CH, Terng HJ, Kao SF, Chan WK, Li HN, Liu CC, et al. A five-gene signature and clinical outcome in non-small-cell lung cancer. N Engl J Med. 2007; 356:11-20.
12. Cancer Genome Atlas Research Network. Comprehensive molecular profiling of lung adenocarcinoma. Nature. 2014; 511:543-550.
13. Subramanian A, Tamayo P, Mootha VK, Mukherjee S, Ebert BL, Gillette MA, Paulovich A, Pomeroy SL, Golub TR, Lander ES, Mesirov JP. Gene set enrichment analysis: a knowledge-based approach for interpreting genome-wide expression profiles. Proc Natl Acad Sci U S A. 2005; 102:15545-15550.
14. Mootha VK, Lindgren CM, Eriksson KF, Subramanian A, Sihag S, Lehar J, Puigserver P, Carlsson E, Ridderstrale M, Laurila E, Houstis N, Daly MJ, Patterson N, et al. PGC-1alpha-responsive genes involved in oxidative phosphorylation are coordinately downregulated in human diabetes. Nat Genet. 2003; 34:267-273.
15. Hannan KM, Sanij E, Rothblum LI, Hannan RD, Pearson RB. Dysregulation of RNA polymerase I transcription during disease. Biochim Biophys Acta. 2013; 1829:342-360.
16. White RJ. RNA polymerases I and III, growth control and cancer. Nat Rev Mol Cell Biol. 2005; 6:69-78.
17. Budde A, Grummt I. p53 represses ribosomal gene transcription. Oncogene. 1999; 18:1119-1124.
18. Zhai W, Comai L. Repression of RNA polymerase I transcription by the tumor suppressor p53. Mol Cell Biol. 2000; 20:5930-5938.
19. Anaya J. OncoLnc: linking TCGA survival data to mRNAs, miRNAs, and lncRNAs. PeerJ Comp Sci. 2016; 2(e67).
20. Maeda R, Yoshida J, Ishii G, Hishida T, Nishimura M, Nagai K. Prognostic impact of histology on early-stage non-small cell lung cancer. Chest. 2011; 140:135-145.
21. Sakao Y, Miyamoto H, Sakuraba M, Oh T, Shiomi K, Sonobe S, Izumi H. Prognostic significance of a histologic subtype in small adenocarcinoma of the lung: the impact of nonbronchioloalveolar carcinoma components. Ann Thorac Surg. 2007; 83:209-214.
22. Rena O, Papalia E, Ruffini E, Casadio C, Filosso PL, Oliaro A, Maggi G. Stage I pure bronchioloalveolar carcinoma: recurrences, survival and comparison with adenocarcinoma of the lung. Eur J Cardiothorac Surg. 2003; 23:409-414.
23. Beer DG, Kardia SL, Huang CC, Giordano TJ, Levin AM, Misek DE, Lin L, Chen G, Gharib TG, Thomas DG, Lizyness ML, Kuick R, Hayasaka S, et al. Gene-expression profiles predict survival of patients with lung adenocarcinoma. Nat Med. 2002; 8:816-824.
24. Bhattacharjee A, Richards WG, Staunton J, Li C, Monti S, Vasa P, Ladd C, Beheshti J, Bueno R, Gillette M, Loda M, Weber G, Mark EJ, et al. Classification of human lung carcinomas by mRNA expression profiling reveals distinct adenocarcinoma subclasses. Proc Natl Acad Sci U S A. 2001; 98:13790-13795.
25. Garber ME, Troyanskaya OG, Schluens K, Petersen S, Thaesler Z, Pacyna-Gengelbach M, van de Rijn M, Rosen GD, Perou CM, Whyte RI, Altman RB, Brown PO, Botstein D, et al. Diversity of gene expression in adenocarcinoma of the lung. Proc Natl Acad Sci U S A. 2001; 98:13784-13789.
26. Wigle DA, Jurisica I, Radulovich N, Pintilie M, Rossant J, Liu N, Lu C, Woodgett J, Seiden I, Johnston M, Keshavjee S, Darling G, Winton T, et al. Molecular profiling of non-small cell lung cancer and correlation with disease-free survival. Cancer Res. 2002; 62:3005-3008.
27. Van Laar RK. Genomic signatures for predicting survival and adjuvant chemotherapy benefit in patients with non-small-cell lung cancer. BMC Med Genomics. 2012; 5:30.
28. Moldvay J, Fabian K, Jackel M, Nemeth Z, Bogos K, Furak J, Tiszlavicz L, Fillinger J, Dome B, Schaff Z. Claudin-1 Protein Expression Is a good prognostic factor in non-small cell lung cancer, but only in squamous cell carcinoma cases. Pathol Oncol Res. 2017; 23:151-156.
29. Edwards YH, Putt W, Fox M, Ives JH. A novel human phosphoglucomutase (PGM5) maps to the centromeric region of chromosome 9. Genomics. 1995; 30:350-353.
30. Uzozie AC, Selevsek N, Wahlander A, Nanni P, Grossmann J, Weber A, Buffoli F, Marra G. Targeted proteomics for multiplexed verification of markers of colorectal tumorigenesis. Mol Cell Proteomics. 2017; 16:407-427.
31. Zhang Y, Foreman O, Wigle DA, Kosari F, Vasmatzis G, Salisbury JL, van Deursen J, Galardy PJ. USP44 regulates centrosome positioning to prevent aneuploidy and suppress tumorigenesis. J Clin Invest. 2012; 122:4362-4374.
32. Czerwinski M, McLemore TL, Gelboin HV, Gonzalez FJ. Quantification of CYP2B7, CYP4B1, and CYPOR messenger RNAs in normal human lung and lung tumors. Cancer Res. 1994; 54:1085-1091.
33. Bankovic J, Stojsic J, Jovanovic D, Andjelkovic T, Milinkovic V, Ruzdijic S, Tanic N. Identification of genes associated with non-small-cell lung cancer promotion and progression. Lung Cancer. 2010; 67:151-159.
34. Mulvihill MS, Kwon YW, Lee S, Fang LT, Choi H, Ray R, Kang HC, Mao JH, Jablons D, Kim IJ. Gremlin is overexpressed in lung adenocarcinoma and increases cell growth and proliferation in normal lung cells. PLoS One. 2012; 7:e42264.
35. Grossi F, Dal Bello MG, Salvi S, Puzone R, Pfeffer U, Fontana V, Alama A, Rijavec E, Barletta G, Genova C, Sini C, Ratto GB, Taviani M, et al. Expression of ribonucleotide reductase subunit-2 and thymidylate synthase correlates with poor prognosis in patients with resected stages I-III non-small cell lung cancer. Dis Markers. 2015; 2015:302649.
36. Mah V, Alavi M, Marquez-Garban DC, Maresh EL, Kim SR, Horvath S, Bagryanova L, Huerta-Yepez S, Chia D, Pietras R, Goodglick L. Ribonucleotide reductase subunit M2 predicts survival in subgroups of patients with non-small cell lung carcinoma: effects of gender and smoking status. PLoS One. 2015; 10:e0127600.