
INTRODUCTION
The frequencies of somatic mutations and copy number aberrations in cancer genomes including colorectal cancer (CRC) genomes are usually very low [1–3], reflecting the molecular heterogeneity of CRC [4, 5]. The extreme molecular heterogeneity of CRC forms a major barrier for therapy, and thus it would be of special importance if we could find common biomarkers besides subtype-specific biomarkers for CRC. Different from somatic mutations and copy number aberrations, DNA methylation aberrations in cancer genomes are widespread in cancer genomes [6, 7], which provides us the possibility to find common epigenetic aberrations in CRC.
Current methods such as Wilcoxon rank-sum test [8] and T-test [9] can only identify differentially methylated (DM) CpG sites between a set of cancer samples and a set of normal controls. However, such population-level DM CpG sites cannot tell us the frequencies of CpG sites differentially methylated in patients. Because the DNA methylation levels of CpG sites in a healthy population vary greatly across different individuals, it would be unreasonable to detect DNA methylation states of CpG sites in each cancer sample by comparing with the average methylation level in a set of normal samples [10, 11]. Recently, we found that within-sample relative expression orderings (REOs) of genes are highly stable across different samples of a particular type of normal tissue but widely disrupted in the corresponding cancer samples [12, 13]. Based on this biological phenomenon, we have developed an algorithm, named RankComp [12], to identify differentially expressed genes in each cancer tissue by finding those genes whose up- or down-regulations may lead to the disrupted REOs of genes within this cancer sample in comparison with the highly stable REOs of genes predetermined in accumulated normal samples. Because the highly stable REOs of genes predetermined in accumulated normal samples can represent the REOs of genes in every normal tissue, the differentially expressed genes identified by the algorithm for each disease sample are the genes that are differentially expressed in this disease sample compared with its own previous normal state.
In this study, through the analysis of DNA methylation data produced by different laboratories, we showed that the relative methylation-level orderings (RMOs) of CpG sites are also highly stable within normal colorectal samples but widely reversed in CRC tissues. Therefore, we supposed that the RankComp algorithm can be used to detect DM CpG sites in cancer samples at the individual-level. Using 75 paired methylation profiles for colorectal cancer tissues and the paired adjacent normal tissues, we firstly evaluated the performance of RankComp by evaluating the identified DM CpG sites in each cancer tissue according to the observed DNA methylation level differences (hyper- or hypo-methylation) between the cancer tissue and its adjacent normal tissue. Since the performance of RankComp was evaluated based on each paired samples, 75 independent tests were performed. Finally, we detected DM genes and significant deregulated pathways in each of 268 CRC samples from The Cancer Genome Atlas (TCGA) and revealed that there are common DNA methylation biomarkers of CRC, which could be important diagnosis makers and therapy targets for CRC.
RESULTS
Performance of RankComp for individualized differential methylation analysis
From two independent datasets, GSE42752 and GSE48684, 7320 and 9962 DM CpG sites were detected between cancer and normal groups (T-test, FDR < 0.01), respectively. The two lists of DM CpG sites have 6060 overlapped CpG sites, among which 98.69% of the overlaps have the concordant hypermethylation or hypomethylation states in the two datasets. These reproducible DM CpG sites were defined as the population-level DM CpG sites for CRC (Supplementary Table 1). Then, we did individualized analysis of the CpG sites for these population-level DM CpG sites using the RankComp algorithm (see Methods).
Firstly, we identified 152,666,734 and 218,691,193 stable CpG site pairs with stable RMOs in at least 99% of the 142 and 82 samples of normal colorectal tissues assayed by the Illumina Human Methylation 27 Beadchip (27K) and 450 Beadchip (450K) arrays (Table 1), respectively. Notably, 90.62% of the stable CpG site pairs in the shorter list were included in the longer list and 99.94% of the overlapped CpG site pairs had the same RMOs patterns for the normal colorectal tissues (binomial test, p < 2.2 × 10⁻¹⁶). This result suggests that the within-sample RMOs of CpG sites in colorectal normal tissues are highly stable and can be reproducibly detected across different datasets measured by different platforms.
Table 1:The DNA methylation profiles analyzed in this study
Dataset |
Normal |
Tumor |
Platform |
|---|---|---|---|
GSE27130 |
118 |
/ |
27 K |
GSE29490 |
24 |
/ |
27 K |
GSE42752 |
41 |
22 |
450 K |
GSE48684 |
41 |
106 |
450 K |
TCGA* |
75 |
75 |
450 K + 27 K |
Note: *represents the paired cancer-normal samples used to evaluate the performance of Rankcomp.
Based on the above finding, we evaluated the performance of RankComp for detecting DM CpG sites in cancer samples at individual-level, using 75 CRC samples with paired adjacent normal tissues from TCGA. Based on the stable CpG site pairs predetermined in the above 224 normal colorectal tissue samples, averagely 4,062 DM CpG sites per sample were identified with FDR < 0.01. Evaluated according to the observed DNA methylation level differences between each cancer tissue and its adjacent normal tissue, RankComp reached an average precision of 91.34% for DM CpG sites detected in individual CRC samples (Figure 1). It suggests that RankComp can accurately find DM CpG sites in an individual CRC sample compared with its own previous normal state approximately represented by its paired adjacent normal tissue.
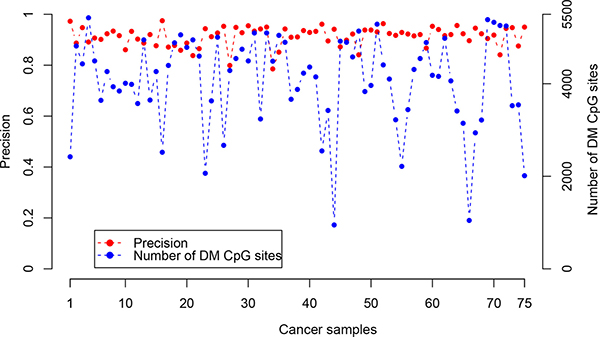
Figure 1: The precision and the number of DM CpG sites detected by RankComp for each of the 75 CRC samples with paired adjacent normal tissues from TCGA.
Universal and subtype-specific DM CpG sites in CRC tissues
Then, we used RankComp to identify DM CpG sites for each of the 268 CRC samples from TCGA. A gene was defined as a DM gene in a disease sample if at least one CpG site within its promoter region was identified as a DM CpG site. Genes with inconsistent methylation aberration states (hypermethylation or hypomethylation) within their promoter regions were excluded from the following analyses.
We found 143 genes that were hypomethylated in more than 95% of the 268 CRC samples (Supplementary Table 2). These genes universally altered in CRC might play important roles in CRC genesis and development. For example, POU5F1 (also known as OCT4), functioning in stem cell pluripotency and embryonic development, was hypomethylated in 98.13% of the 268 cancer samples, which is concordant with the findings that this gene is overexpressed in CRC [14] and may contribute to CRC development [15]. For another example, DNAJB8 was hypomethylated in 97.76% of the 268 CRC samples, which is concordant with the findings that this gene’s overexpression can enhance tumorigenicity of CRC cells [16]. Similarly, we found 26 genes that were hypermethylated in more than 95% of the 268 CRC samples (Supplementary Table 2). Because it is well known that hypermethylation of CpG sites in gene promoter regions tend to silence gene expression [17], we further analyzed whether the 26 genes universally hypermethylated in the CRC tissues are frequently deregulated in CRC tissues. Using 16 paired samples of cancer and its adjacent normal tissues with both DNA methylation profiles and gene expression profiles available from TCGA, we found that 14 of the 26 hypermethylated genes had lower gene expression levels in the cancer tissues than in the corresponding adjacent normal tissues in at least 15 of the 16 paired samples (Table 2). Among these 14 genes, five genes (FLI1, IRF4, NTRK3, SLC6A15, KCNQ5) were known cancer driver genes documented in the F-Census database [18]. For example, IRF4, hypermethylated in 99.63% of the 268 CRC samples and downregulated in all the 16 paired cancer tissues, is an important transcript factor for the regulation of interferon-inducible genes and its promoter hypermethylation is a potential biomarker for the diagnosis and therapy of CRC [19]. NTRK3 (also known as TRKC), hypermethylated in 97.76% of the 268 CRC samples, was found to be hypermethylated and downregulated in 15 of the 16 cancer tissues compared with their paired adjacent normal tissues respectively. This gene is a colorectal cancer tumor suppressor gene [20, 21]. Besides the five cancer driver genes, we found that TMEFF2 (also known as HPP1), hypermethylated in 95.52% of the 268 CRC samples, was hypermethylated and downregulated in all the 16 cancer tissues compared with their paired adjacent normal tissues. It has been reported that hypermethylation of this gene may promote the growth and invasive potential of CRC cancer cells [22, 23]. ADHFE1, hypermethylated in 98.13% of the 268 CRC samples, was hypermethylated and downregulated in all the 16 cancer tissues compared with their paired adjacent normal tissues. The downregulation of this gene may induce the proliferation of CRC cells [24]. These results suggested that these frequently hypermethylated and down-regulated genes could be essential medical targets for CRC.
Table 2: Down-deregulation numbers of the 14 frequently hypermethylated genes in 16 CRC samples compared with their paired adjacent normal tissues from TCGA
Gene Symble |
Hypermethylation frequency |
Down-regulated samples |
Gene Symble |
Hypermethylation frequency |
Down-regulated samples |
|---|---|---|---|---|---|
ADHFE1 |
98.13% |
16 |
CNRIP1 |
97.76% |
15 |
TMEFF2 |
95.52% |
16 |
ZNF134 |
96.27% |
15 |
IRF4 |
99.63% |
16 |
PHOX2A |
97.01% |
15 |
ZNF132 |
97.01% |
16 |
FLI1 |
97.01% |
15 |
NSG1 |
96.27% |
16 |
NTRK3 |
97.76% |
15 |
NELL1 |
97.01% |
16 |
KCNQ5 |
98.51% |
15 |
SLC6A15 |
95.15% |
15 |
GPM6A |
97.76% |
15 |
On the other hand, we found 1288 and 1787 genes that were hypermethylated or hypomethylated in 20–80% of the 268 CRC samples, reflecting the heterogeneity of DNA methylation aberrations across different CRC genomes. Such genes might be subtype-specific genes associated with patients’ prognoses. One important clinical problem for CRC is to develop a signature for predicting prognoses of early-stage (stage I and II) patients undergoing curative surgery since nearly 4% of stage I [25] and 25–30% of stage II [26, 27] patients with curative surgery only will experience relapse. Here, using the overall survival time data of 103 TCGA samples of stage I and II CRC patients with complete surgical resection only, we evaluated whether the patients with and without the deregulation of a gene were significantly different in overall survival (OS) time. Using the univariate Cox proportional-hazards regression model [28], 12 hypermethylated genes and 8 hypomethylated genes were identified to be significantly associated with OS time of stage I and II CRC patients treated with complete surgical resection only (p-value < 0.01) (Supplementary Table 3). For example, ODAM was hypermethyled in 24.27% of the 103 stage I-II CRC patients and these patients had significantly shorter OS time (log-rank test, p = 0.0009) than the other patients without ODAM hypermethylation (Figure 2). This was consistent with a previous report that down-regulation of ODAM is correlated with decreased overall survival in colorectal cancer since ODAM plays a protective role by inhibiting cells proliferation and metastasis in CRC [29].
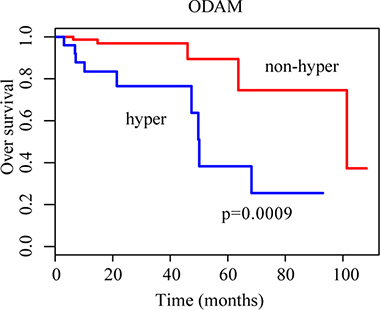
Figure 2: Kaplan-Meier curves for patients grouped based on ODAM methylation. The blue and red lines represent patients with and without hypermethylation, respectively.
Individualized analysis of pathways for CRC
After identifying DM genes for a disease sample, we were able to detect pathways significantly enriched with the DM genes for this cancer sample.
With FDR < 0.1, 27 pathways were significantly enriched with hypermethylated genes in at least 30% of the 268 CRC samples from TCGA. Especially, three cancer-associated pathways for calcium signaling [30], cell adhesion molecules (CAMs) [31, 32] and neuroactive ligand-receptor interaction [33, 34] were significantly enriched with hypermethylated genes in more than 90% (93.66%, 93.66% and 92.91%, respectively) of the 268 CRC samples (Figure 3A). Similarly, among the eight pathways that were significantly enriched with hypomethylated genes in at least 30% of the 268 CRC samples (Figure 3B), we found that three cancer-associated pathways for cytokine-cytokine receptor interaction (93.66%) [35], neuroactive ligand-receptor interaction (92.16%) [33, 34] and olfactory transduction (92.16%) [36, 37] were significant in more than 90% of the 268 CRC samples. These pathways commonly altered in CRC might be important for studying the mechanisms of CRC.
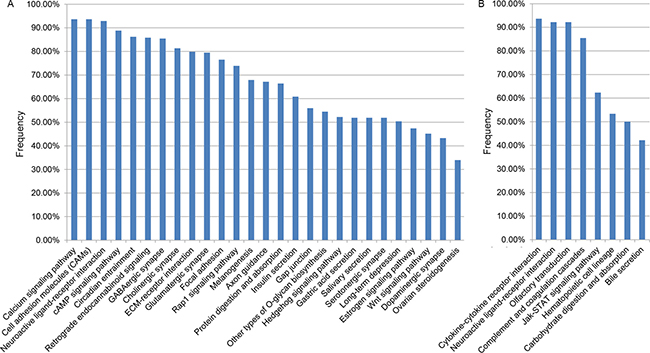
Figure 3: The KEGG pathways separately enriched with hypermethylation (A) and hypomethylation (B) genes in at least 30% of the 268 TCGA CRC samples.
DISCUSSION
In this work, we have confirmed that the within-sample RMOs of CpG sites keep highly stable in normal colorectal tissues, which are widely disrupted in CRC tissues. The intrinsic biological phenomena provide a basis for identifying DM CpG sites in CRC samples at individual-level through analyzing the widely disrupted RMOs of CpG sites within every individual cancer sample, taking the predetermined stable RMOs landscape in normal samples as the background. In fact, our result revealed that RankComp can accurately identify DM CpG sites for cancer samples at individual-level.
The individualized analysis of DM genes makes it possible to estimate the frequency of an epigenetic aberration in a particular type of cancer such like CRC. The application of the individual-level analysis to 268 CRC samples revealed universal and subtype-specific DM genes and pathways for CRC. Especially, we found 26 and 143 genes that were hypermethylated and hypomethylated, respectively, in more than 95% of the 268 CRC samples. These universally aberrant DNA methylation genes and pathways may be important diagnostic makers and therapy targets for CRC, which deserves our future investigation. On the other hand, genes and pathways with DNA methylation aberrations in a part of the CRC samples could be subtype-specific, which provide hints for dissecting the inter-individual heterogeneity of CRC. Notably, researchers have recently proposed new methods such as CellMethy [38] and CpG_MPs [39] to identify another type of disease methylation biomarkers namely differential concordant methylation of adjacent CpGs, which may provide insight into methylation mechanisms. In line with this direction, we could use a slide window to find adjacent CpGs with concordant methylation aberration status in disease samples after identifying DM CpG sites for individual cancer samples by RankComp, and this may deserve our future study.
In summary, the individual-level analysis of DM CpG sites reveals that there are common DNA methylation biomarkers, besides subtype-specific biomarkers, for CRC, which could be important diagnosis makers and therapy targets for CRC.
MATERIALS AND METHODS
Data and preprocessing
DNA methylation profiles for colorectal tissues were collected from the Gene Expression Omnibus (GEO) [40] database and The Cancer Genome Atlas data portal (https://tcga-data.nci.nih.gov/docs/publications/tcga/?). As described in Table 1, DNA methylation profiles for 75 paired samples of cancer and adjacent normal tissues from TCGA were used to evaluate the performance of RankComp, and the other DNA methylation profiles in normal tissues were used to evaluate the RMOs of CpG sites in normal colorectal tissues. The DNA methylation profiles of 268 samples of CRC were downloaded from TCGA for finding universal and subtype-specific differentially methylated CpG sites in CRC based on individualized differential methylation analysis.
Here, we only analyzed the 25,978 CpG sites measured by both the 27 K array and 450 K array. Using methylated signal intensity (M) and unmethylated signal intensity (U), the DNA methylation level of each probe was calculated by M/(U + M + 100) [41]. The probes were annotated to genes according to the annotation table of 27 K platform.
Identification of the stable RMOs of CpG sites in normal colorectal tissues
The RMO of two CpG sites (A and B) was defined as stable when their RMO (A > B or A < B in methylation level) was identical in at least 99% of the colorectal normal samples collected from multiple data sources, allowing 1% detection error rate.
To evaluate the reproducibility of stable RMOs of CpG sites between different platforms, we identified two lists of stable CpG site pairs in the normal samples assayed by 27 K and in the normal samples assayed by 450 K, respectively, and then calculated their concordance. If the two lists of stable CpG site pairs shared k stable CpG site pairs, among which s pairs had the same RMO patterns in the two lists, then the concordance score was calculated as s/k. The probability of observing this concordance score by chance was calculated according to the cumulative binomial distribution model [42].
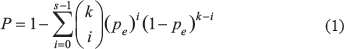
Where Pe (Pe =0.5) is the probability of the RMO of one CpG site pair shared by the two lists by chance.
Identification of individual-level DM CpG sites by the RankComp algorithm
The flowchart of using RankComp for detecting individual-level DM CpG sites is shown in Figure 4.
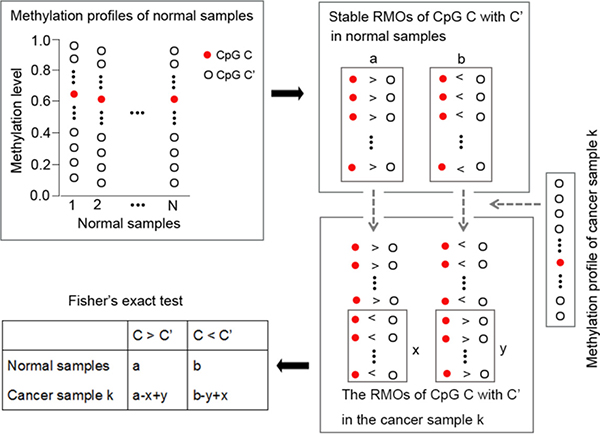
Figure 4: The flowchart of the individual-level DM CpG sites analysis with RankComp algorithm.
As shown in Figure 4, highly stable CpG site pairs with consistent RMOs in at least 99% of normal samples accumulated from different laboratories were identified, which were next used as normal background. Second, we identified reversal CpG site pairs of each CpG site for a given cancer sample in comparison with their stable RMOs in normal samples. Finally, the Fisher’s exact test was used to determine whether a CpG site was differentially methylated in a given cancer sample by testing the null hypothesis that the proportion of reversal CpG site pairs supporting the hypermethylation of this CpG site was equal to the proportion of reversal CpG site pairs supporting the hypomethylation of this CpG site. For a given CpG site C, if its methylation level was stably lower (or higher) than that of a CpG site C’ in the normal samples but this ordering was reversed in a cancer sample, then this reversal CpG site pair could support hypermethylation (or hypomethylation) of C in this cancer sample. The detail of the RankComp algorithm, previously developed for detecting individual-level differential expression genes, is described in [12]. The software of the RankComp algorithm is available at https://github.com/pathint/reoa.
Performance evaluation of RankComp
To ensure the individual-level DM CpG sites to be associated with cancer, we focused on individualizing the CpG sites that were found to be differentially methylated at the population-level. Thus, the T-test was used to detect population-level DM CpG sites between cancer samples and normal controls using two independent datasets, respectively, and the DM CpG sites consistently detected from the two independent datasets were defined as the population-level DM CpG sites for CRC. The p-values were adjusted using the Benjamini-Hochberg procedure [43].
The DNA methylation profiles for 75 CRC tissue samples with paired adjacent normal tissues were used to evaluate the performance of RankComp. We firstly identified DM CpG sites in each of the 75 cancer samples by RankComp using DNA methylation data on cancer samples alone. We then evaluated the precision of individual-level DM CpG sites for each of the cancer samples using the observed methylation level differences (hypermethylation or hypomethylation) between this cancer sample and its paired adjacent normal sample as the golden standard. The underlying assumption of this evaluation is that the previously normal state of a cancer tissue could be approximately represented by the adjacent normal tissue of the cancer tissue. For a cancer sample, if the hypermethylation or hypomethylation states of DM CpG sites detected by RankComp are consistent with the golden standard, then they are defined as true positives (TP); otherwise, false positives (FP). The precision of the DM CpG sites detected for each CRC sample is calculated as the positive predictive value: TP/(TP + FP). Since the performance of RankComp was evaluated based on each paired samples, 75 independent tests were performed.
KEGG pathways
For pathway enrichment analysis, data of 234 pathways covering 5981 unique genes was downloaded from the Kyoto Encyclopedia of Genes and Genomes (KEGG) (Release 58.0) [44]. The hypergeometric distribution model was used to determine the biological pathways that were significantly enriched with hyper- and hypomethylated genes, respectively [45]. The p-values were adjusted using the Benjamini-Hochberg procedure [43].
Abbreviations
CRC: colorectal cancer; RMOs: relative methylation-level orderings; DM: differentially methylated; TCGA: The Cancer Genome Atlas; 27 K: Illumina Human Methylation 27 Beadchip; 450 K: Illumina Human Methylation 450 Beadchip; TP: true positives; FP: false positives.
CONFLICTS OF INTEREST
No potential conflicts of interest were disclosed.
GRANT SUPPORT
This work was supported by the National Natural Science Foundation of China [grant numbers. 81372213, 81572935, 81501215, 81501829, 81602738 and 61602119].
REFERENCES
1. Hudson AM, Yates T, Li Y, Trotter EW, Fawdar S, Chapman P, Lorigan P, Biankin A, Miller CJ, Brognard J. Discrepancies in cancer genomic sequencing highlight opportunities for driver mutation discovery. Cancer Res. 2014; 74:6390–6396.
2. Wang K, Lim HY, Shi S, Lee J, Deng S, Xie T, Zhu Z, Wang Y, Pocalyko D, Yang WJ, Rejto PA, Mao M, Park CK, et al. Genomic landscape of copy number aberrations enables the identification of oncogenic drivers in hepatocellular carcinoma. Hepatology. 2013; 58:706–717.
3. Wang K, Yuen ST, Xu J, Lee SP, Yan HH, Shi ST, Siu HC, Deng S, Chu KM, Law S, Chan KH, Chan AS, Tsui WY, et al. Whole-genome sequencing and comprehensive molecular profiling identify new driver mutations in gastric cancer. Nat Genet. 2014; 46:573–582.
4. Linnekamp JF, Wang X, Medema JP, Vermeulen L. Colorectal cancer heterogeneity and targeted therapy: a case for molecular disease subtypes. Cancer Res. 2015; 75:245–249.
5. Hinoue T, Weisenberger DJ, Lange CP, Shen H, Byun HM, Van Den Berg D, Malik S, Pan F, Noushmehr H, van Dijk CM, Tollenaar RA, Laird PW. Genome-scale analysis of aberrant DNA methylation in colorectal cancer. Genome Res. 2012; 22:271–282.
6. Baylin SB, Herman JG, Graff JR, Vertino PM, Issa JP. Alterations in DNA methylation: a fundamental aspect of neoplasia. Adv Cancer Res. 1998; 72:141–196.
7. Bergman Y, Cedar H. DNA methylation dynamics in health and disease. Nat Struct Mol Biol. 2013; 20:274–281.
8. Heyn H, Carmona FJ, Gomez A, Ferreira HJ, Bell JT, Sayols S, Ward K, Stefansson OA, Moran S, Sandoval J, Eyfjord JE, Spector TD, Esteller M. DNA methylation profiling in breast cancer discordant identical twins identifies DOK7 as novel epigenetic biomarker. Carcinogenesis. 2013; 34:102–108.
9. Bibikova M, Chudin E, Wu B, Zhou L, Garcia EW, Liu Y, Shin S, Plaia TW, Auerbach JM, Arking DE, Gonzalez R, Crook J, Davidson B, et al. Human embryonic stem cells have a unique epigenetic signature. Genome Res. 2006; 16:1075–1083.
10. Shen X, Li S, Zhang L, Li H, Hong G, Zhou X, Zheng T, Zhang W, Hao C, Shi T, Liu C, Guo Z. An integrated approach to uncover driver genes in breast cancer methylation genomes. PLoS One. 2013; 8:e61214.
11. Jung S, Kim S, Gale M, Cherni I, Fonseca R, Carpten J, Salhia B. DNA methylation in multiple myeloma is weakly associated with gene transcription. PLoS One. 2012; 7:e52626.
12. Wang H, Sun Q, Zhao W, Qi L, Gu Y, Li P, Zhang M, Li Y, Liu SL, Guo Z. Individual-level analysis of differential expression of genes and pathways for personalized medicine. Bioinformatics. 2015; 31:62–68.
13. Guan Q, Chen R, Yan H, Cai H, Guo Y, Li M, Li X, Tong M, Ao L, Li H, Hong G, Guo Z. Differential expression analysis for individual cancer samples based on robust within-sample relative gene expression orderings across multiple profiling platforms. Oncotarget. 2016; 7:68909–68920. doi: 10.18632/oncotarget.11996.
14. Gazouli M, Roubelakis MG, Theodoropoulos GE, Papailiou J, Vaiopoulou A, Pappa KI, Nikiteas N, Anagnou NP. OCT4 spliced variant OCT4B1 is expressed in human colorectal cancer. Mol Carcinog. 2012; 51:165–173.
15. Dai X, Ge J, Wang X, Qian X, Zhang C, Li X. OCT4 regulates epithelial-mesenchymal transition and its knockdown inhibits colorectal cancer cell migration and invasion. Oncol Rep. 2013; 29:155–160.
16. Morita R, Nishizawa S, Torigoe T, Takahashi A, Tamura Y, Tsukahara T, Kanaseki T, Sokolovskaya A, Kochin V, Kondo T, Hashino S, Asaka M, Hara I, et al. Heat shock protein DNAJB8 is a novel target for immunotherapy of colon cancer-initiating cells. Cancer Sci. 2014; 105:389–395.
17. Yao C, Li H, Shen X, He Z, He L, Guo Z. Reproducibility and concordance of differential DNA methylation and gene expression in cancer. PLoS One. 2012; 7:e29686.
18. Gong X, Wu R, Zhang Y, Zhao W, Cheng L, Gu Y, Zhang L, Wang J, Zhu J, Guo Z. Extracting consistent knowledge from highly inconsistent cancer gene data sources. BMC Bioinformatics. 2010; 11:76.
19. Tian X, Sun D, Zhao S, Xiong H, Fang J. Screening of potential diagnostic markers and therapeutic targets against colorectal cancer. Onco Targets Ther. 2015; 8:1691–1699.
20. Luo Y, Kaz AM, Kanngurn S, Welsch P, Morris SM, Wang J, Lutterbaugh JD, Markowitz SD, Grady WM. NTRK3 is a potential tumor suppressor gene commonly inactivated by epigenetic mechanisms in colorectal cancer. PLoS Genet. 2013; 9:e1003552.
21. Genevois AL, Ichim G, Coissieux MM, Lambert MP, Lavial F, Goldschneider D, Jarrosson-Wuilleme L, Lepinasse F, Gouysse G, Herceg Z, Scoazec JY, Tauszig-Delamasure S, Mehlen P. Dependence receptor TrkC is a putative colon cancer tumor suppressor. Proc Natl Acad Sci USA. 2013; 110:3017–3022.
22. Sato F, Shibata D, Harpaz N, Xu Y, Yin J, Mori Y, Wang S, Olaru A, Deacu E, Selaru FM, Kimos MC, Hytiroglou P, Young J, et al. Aberrant methylation of the HPP1 gene in ulcerative colitis-associated colorectal carcinoma. Cancer Res. 2002; 62:6820–6822.
23. Young J, Biden KG, Simms LA, Huggard P, Karamatic R, Eyre HJ, Sutherland GR, Herath N, Barker M, Anderson GJ, Fitzpatrick DR, Ramm GA, Jass JR, et al. HPP1: a transmembrane protein-encoding gene commonly methylated in colorectal polyps and cancers. Proc Natl Acad Sci USA. 2001; 98:265–270.
24. Moon JW, Lee SK, Lee YW, Lee JO, Kim N, Lee HJ, Seo JS, Kim J, Kim HS, Park SH. Alcohol induces cell proliferation via hypermethylation of ADHFE1 in colorectal cancer cells. BMC cancer. 2014; 14:377.
25. Lee JH, Lee JL, Park IJ, Lim SB, Yu CS, Kim JC. Identification of Recurrence-Predictive Indicators in Stage I Colorectal Cancer. World J Surg. 2017; 41:1126–1133.
26. Schmoll HJ, Van Cutsem E, Stein A, Valentini V, Glimelius B, Haustermans K, Nordlinger B, van de Velde CJ, Balmana J, Regula J, Nagtegaal ID, Beets-Tan RG, Arnold D, et al. ESMO Consensus Guidelines for management of patients with colon and rectal cancer. a personalized approach to clinical decision making. Ann Oncol. 2012; 23:2479–2516.
27. Gill S, Loprinzi CL, Sargent DJ, Thome SD, Alberts SR, Haller DG, Benedetti J, Francini G, Shepherd LE, Francois Seitz J, Labianca R, Chen W, Cha SS, et al. Pooled analysis of fluorouracil-based adjuvant therapy for stage II and III colon cancer: who benefits and by how much? J Clin Oncol. 2004; 22:1797–1806.
28. Cox DR. Regression Models and Life-Tables. Journal of the Royal Statistical Society. 1972; 34:187–220.
29. Yu M, Mu Y, Qi Y, Qin S, Qiu Y, Cui R, Zhong M. Odontogenic ameloblast-associated protein (ODAM) inhibits human colorectal cancer growth by promoting PTEN elevation and inactivating PI3K/AKT signaling. Biomed Pharmacother. 2016; 84:601–607.
30. Taylor JT, Zeng XB, Pottle JE, Lee K, Wang AR, Yi SG, Scruggs JA, Sikka SS, Li M. Calcium signaling and T-type calcium channels in cancer cell cycling. World J Gastroenterol. 2008; 14:4984–4991.
31. Makrilia N, Kollias A, Manolopoulos L, Syrigos K. Cell adhesion molecules: role and clinical significance in cancer. Cancer Invest. 2009; 27:1023–1037.
32. Paschos KA, Canovas D, Bird NC. The role of cell adhesion molecules in the progression of colorectal cancer and the development of liver metastasis. Cell Signal. 2009; 21: 665–674.
33. Wei P, Tang H, Li D. Insights into pancreatic cancer etiology from pathway analysis of genome-wide association study data. PLoS One. 2012; 7:e46887.
34. Albertini MC, Olivieri F, Lazzarini R, Pilolli F, Galli F, Spada G, Accorsi A, Rippo MR, Procopio AD. Predicting microRNA modulation in human prostate cancer using a simple String IDentifier (SID1.0). J Biomed Inform. 2011; 44:615–620.
35. Matei D, Fang F, Shen C, Schilder J, Arnold A, Zeng Y, Berry WA, Huang T, Nephew KP. Epigenetic resensitization to platinum in ovarian cancer. Cancer Res. 2012; 72: 2197–2205.
36. Neuhaus EM, Zhang W, Gelis L, Deng Y, Noldus J, Hatt H. Activation of an olfactory receptor inhibits proliferation of prostate cancer cells. J Biol Chem. 2009; 284:16218–16225.
37. Zhang W, Edwards A, Fan W, Flemington EK, Zhang K. miRNA-mRNA correlation-network modules in human prostate cancer and the differences between primary and metastatic tumor subtypes. PLoS One. 2012; 7:e40130.
38. Wang F, Zhang S, Liu H, Wei Y, Wang Y, Han X, Su J, Zhang D, Xie B, Zhang Y. CellMethy: Identification of a focal concordantly methylated pattern of CpGs revealed wide differences between normal and cancer tissues. Sci Rep. 2015; 5:18037.
39. Su J, Yan H, Wei Y, Liu H, Liu H, Wang F, Lv J, Wu Q, Zhang Y. CpG_MPs: identification of CpG methylation patterns of genomic regions from high-throughput bisulfite sequencing data. Nucleic Acids Res. 2013; 41:e4.
40. Edgar R, Domrachev M, Lash AE. Gene Expression Omnibus: NCBI gene expression and hybridization array data repository. Nucleic Acids Res. 2002; 30:207–210.
41. Dedeurwaerder S, Defrance M, Calonne E, Denis H, Sotiriou C, Fuks F. Evaluation of the Infinium Methylation 450 K technology. Epigenomics. 2011; 3:771–784.
42. Bahn AK. Application of binomial distribution to medicine: comparison of one sample proportion to an expected proportion (for small samples). Evaluation of a new treatment. Evaluation of a risk factor. J Am Med Womens Assoc. 1969; 24:957–966.
43. Benjamini A, Hochberg Y. Conrolling the False Discovery Rate: A practical and Powerful Approach to Multiple Testing. Journal of the Royal Statistical Society. 1995; 57:289–300.
44. Kanehisa M, Goto S. KEGG: kyoto encyclopedia of genes and genomes. Nucleic Acids Res. 2000; 28:27–30.
45. Hong G, Zhang W, Li H, Shen X, Guo Z. Separate enrichment analysis of pathways for up- and downregulated genes. J R Soc Interface. 2014; 11:20130950.