
INTRODUCTION
Soft tissue sarcomas are rare and aggressive malignancies that develop from the mesenchymal tissue. The incidence rate has increased over the past 35 years as there are approximately 12,000 new cases of soft tissue sarcoma diagnosed and 4,800 deaths each year in the United States [1–3]. A recent report from the National Cancer Institute shows that the 5-year relative survival rate for soft tissue sarcoma is approximately 65% (http://www.cancer.gov/research/progress/snapshots/sarcoma) [4]. Systemic therapy options for sarcoma remain limited. Adjuvant radiotherapy plays a critical role in integrated multimodality treatment of sarcoma [5].
However, due to the complex heterogeneity of sarcoma, not all treated patients benefit from radiotherapy. For certain radiosensitive histological subtypes, such as myxoid liposarcoma, pre-operative radiotherapy may be particularly advantageous [6, 7]. Ewing’s sarcoma is also considered as a relative radiosensitive type [8]. A retrospective study has shown that preoperative radiotherapy might be not suitable for all patients with primary soft tissue sarcoma of the limbs [9]. Late and chronic toxicities of radiotherapy, such as severe induration, loss of subcutaneous tissue, subcutaneous fibrosis are often concerned [5, 10, 11]. Radiation-induced bone fractures are serious complications occurring in 2-20% of patients treated with limb-sparing surgery and radiotherapy [12]. Therefore, the survival benefit of radiotherapy on soft tissue sarcomas have not been observed significantly [13–15]. We argue that if we can develop a radiosensitivity signature, we might be able to identify right patients for radiotherapy.
In the era of precision medicine, personalized radiation therapy, through the use of biomarkers to guide exclusive radiotherapy and/or combination therapy, has started to emerge in recent years [16]. Various gene signatures with specificity in terms of diagnosis, prognosis or prediction of a therapeutic response have been developed and validated [17, 18]. Gene signatures have been used to predict radiosensitive patients in many cancer types, including glioblastoma, cervical, breast, colorectal, head and neck cancer cells [19–23]. However, there is no effective radiosensitive gene signature well developed for sarcoma.
In this paper, we utilized the RNAseq data for soft tissue sarcoma from The Cancer Genome Atlas (TCGA, http://cancergenome.nih.gov/) to develop a radiosensitive gene signature for predicting radiosensitive patients. Since sarcoma is a rare disease, it is difficult to find another independent dataset with survival outcome and enough RNAseq data to do independent-sample validation. Furthermore, due to the limitation of the small sample size in the TCGA dataset, it is not ideal to do split-sample validation. To overcome these difficulties, we performed an internal cross validation via the cross-validated adaptive signature design that combined the gene signature development and the validation test in a single pivotal trial, as introduced by Freidlin and Simon (2005) and Freidlin (2010) [24, 25]. Following this novel idea, we extended this approach to the proportional hazard model and developed a radiosensitive gene signature for predicting radiosensitive patients in sarcoma.
RESULTS
Survival analysis on clinical information
Table 1 summarizes the results of the clinical information. Univariate and multivariable analyses showed that most of the clinical factors, including radiotherapy, are not significant predictors for overall survival. The poor associations between clinical factors and overall survival might suggest that genetic factors play an important role in predicting survival outcome of soft tissue sarcoma.
Table 1: Patients clinical characters and results of univariate and multivariate Cox regression analysis
Characteristic |
No |
Univariate analysis |
Multivariable analysis |
|||
|---|---|---|---|---|---|---|
HR (95% CI) |
p values |
HR (95% CI) |
p values |
|||
Gender |
||||||
Female |
138 |
1.00 |
1.00 |
|||
Male |
115 |
0.869(0.581-1.301) |
0.496 |
0.843(0.517-1.374) |
0.493 |
|
Age(median: 61, range: 20 to 90) |
||||||
<60 |
112 |
1.00 |
1.00 |
|||
≥60 |
141 |
1.322(0.879-1.988) |
0.180 |
1.373(0.852-2.215) |
0.193 |
|
Race |
||||||
White |
221 |
1.00 |
1.00 |
|||
Nonwhite |
24 |
1.406(0.675-2.929) |
0.362 |
1.999(0.867-4.607) |
0.103 |
|
[Unknown] |
8 |
|||||
History of malignancy |
||||||
No |
213 |
1.00 |
1.00 |
|||
Yes |
40 |
0.941(0.534-1.659) |
0.834 |
1.119(0.600-2.090) |
0.723 |
|
Histologic diagnosis |
||||||
LMS |
100 |
1.00 |
1.00 |
|||
DLS |
58 |
1.195(0.725-1.972) |
0.485 |
0.863(0.447-1.664) |
0.659 |
|
MFS+DT |
25+2 |
0.769(0.373-1.585) |
0.476 |
1.008(0.431-2.360) |
0.985 |
|
MPNST |
9 |
1.040(0.322-3.367) |
0.947 |
0.756(0.182-3.145) |
0.700 |
|
SS |
10 |
0.978(0.350-2.735) |
0.967 |
1.848(0.605-5.642) |
0.281 |
|
UPS |
49 |
1.076(0.601-1.926) |
0.806 |
1.138(0.563-2.299) |
0.718 |
|
Margin status |
||||||
Negative |
134 |
1.00 |
1.00 |
|||
Positive |
71 |
1.780(1.105-2.866) |
0.019 |
1.027(0.356-2.964) |
0.957 |
|
[Unknown] |
48 |
|||||
Residual tumor |
||||||
R0 |
152 |
1.00 |
1.00 |
|||
R1 |
66 |
2.140(1.365-3.355) |
0.001 |
2.345(0.934-5.886) |
0.068 |
|
R2 |
8 |
12.601(5.579-28.459) |
<.0001 |
10.430(3.266-33.304) |
<.0001 |
|
RX |
27 |
2.165(1.140-4.109) |
0.018 |
2.311(1.095-4.879) |
0.028 |
|
Tumor depth |
||||||
Superficial |
20 |
1.00 |
1.00 |
|||
Deep |
184 |
2.529(0.692-9.247) |
0.156 |
1.800(0.429-7.547) |
0.408 |
|
[Unknown] |
49 |
|||||
Tumor necrosis |
||||||
0% |
66 |
1.00 |
1.00 |
|||
<10% |
38 |
1.348(0.740-2.454) |
0.328 |
1.629(0.717-3.701) |
0.233 |
|
≥10% ~ 50% |
61 |
1.484(0.853-2.582) |
0.159 |
1.364(0.722-2.575) |
0.332 |
|
>50% |
12 |
1.614(0.631-4.129) |
0.314 |
1.515(0.474-4.846) |
0.472 |
|
[Unknown] |
76 |
|||||
Multifocal |
||||||
NO |
192 |
1.00 |
1.00 |
|||
YES |
39 |
2.178(1.351-3.512) |
0.001 |
1.541(0.845-2.808) |
0.158 |
|
[Unknown] |
22 |
|||||
Radiotherapy |
||||||
No |
177 |
1.00 |
1.00 |
|||
Yes |
76 |
0.850(0.545-1.325) |
0.473 |
0.855(0.488-1.498) |
0.583 |
|
Chemotherapy |
||||||
No |
195 |
1.00 |
1.00 |
|||
Yes |
57 |
1.205(0.764-1.902) |
0.423 |
1.216(0.696-2.127) |
0.492 |
|
[Unknown] |
7 |
|||||
Status |
||||||
Dead |
97 |
|||||
Censor |
156 |
|||||
Survival time (month) |
||||||
Median (95%CI): 65.4 (54.1-88.4) |
||||||
5-year survival rate (%): 54.80 (47.50-63.20) |
||||||
Note: nonwhite group including African American (18 patients) and Asian (6 patients); LMS: Leiomyosarcoma; DLS: Dedifferentiated liposarcoma; UPS: Undifferentiated Pleomorphic Sarcoma; MFS: Myxofibrosarcoma; DT: Desmoid Tumor; SS: Synovial Sarcoma; MPNT: Malignant Peripheral Nerve Sheath Tumors.
Development of a radiosensitive gene signature
Following the proposed procedure, we analyzed the current data set to obtain the tuning parameters by 10-fold cross-validation. The 10 loops could produce 10 combinations of tuning parameters and the gene signature might be different. Theoretically, the reselection of the significant genes for different loops of the cross-validation is essential to the validity of the approach [26]. However, it does not mean that the classifications and selection are unstable or that the classifier will not predict accurately for independent data. Genomic signatures are generally not unique [25, 27]. As suggested by Freidlin [25], to save computational time, the first cross-validation subset could be used to select the tuning parameter. The minimum p value (p=4.810E-04) was reached when the top 26 significant genes were included with a threshold nHR of 0.035 for predicting the sensitive patients. Supplementry Figure 1 presents the p-values profiles by log-rank tests between radiotherapy and nonradiotherapy groups when different tuning parameters combinations were used in the first loop of cross-validation procedure. Supplementry Table 1 shows the genes included in the radiosensitive gene signature and their interaction effects with radiotherapy.
Validation of the radiosensitivity prediction
Following the standard validation procedure, we predicted 101 patients as radiosensitive patients, and divided patients into four subgroups: predicted radiosensitive patients who received radiotherapy, predicted radiosensitive patients who did not receive radiotherapy, predicted nonradiosensitive patients who received radiotherapy and predicted nonradiosensitive patients who did not receive radiotherapy. We compared the survival for these four subgroups. Figure 1(a) shows the survival curves for predicted radiosensitive patients. The significant difference suggested that the predicted radiosensitive patients strongly benefited from radiotherapy compared with non-radiotherapy. Figure 1(b) shows significant differences between nonradiosensitive patients under radiotherapy and non-radiotherapy, suggesting that radiotherapy not only did not benefit, but worsen the survival for nonradiosensitive patients. We further compared the survival among radiosensitive and nonradiosensitive patients all under radiotherapy treatment, shown in Figure 1(c). As expected, strong positive effect of radiotherapy on radiosensitive patients were observed. In addition, there was no significant difference in survival between radiosensitive and nonradiosensitive patients who did not receive radiotherapy treatmentas shown in Figure 1(d). Taken together, as expected, the radiosensitive gene signature provide powerful predictive values for both radiosensitive and nonradiosensitive in radiotherapy.
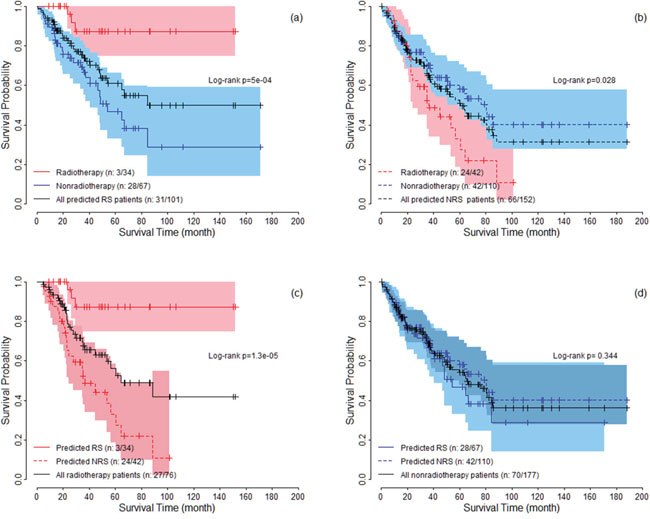
Figure 1: The survival curves under radiotherapy and nonradiotherapy for both predicted radiosensitive (RS) and nonradiosensitive (NRS) patients. The colored areas denote the 95% confidence intervals for survival rate.
In addition, we further performed multivariable analysis using the Cox proportional hazard regression to assess the effect of radiotherapy on overall survival for radiosensitive and nonradiosensitive patients. The adjusted factors included age, gender, chemotherapy, historic type, and residual tumor (residual tumor is the only significant factor associated with overall survival in Table 1). Figure 2(a) shows that radiotherapy strongly improved the survival for radiosensitive patients, while for nonradiosensitive patients, radiotherapy might be a risk factor, with the adjusted HR as 2.17(1.12 to 4.2). When both radiosensitive and nonradiosensitive patients all received radiotherapy, radiosensitive patients had a significantly higher probability of survival than nonradiosensitive patients, while there is no significant difference in the probability of survival between radiosensitive and nonradiosensitive patients who did not receive radiotherapy, as shown in Figure 2(b). These results suggest that the prediction on radiosensitive patients were accurate and effective.
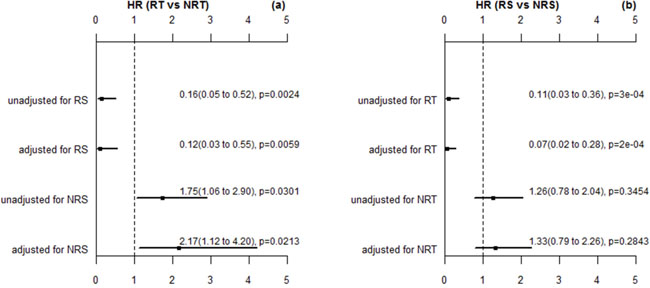
Figure 2: The HR estimation for radiotherapy (RT) verse nonradiotherapy (NRT) and radiosensitive (RS) verse nonradiosensitive (NRS). These p values here are estimated by wald test. The adjusted factors are gender, age, chemotherapy, histologic type, and residual rumor (the significant factor in multivariable analysis).
Associations among radiotherapy and clinical assessments after adjuvant treatments
To further validate the signature, we further compared the rate of new tumor event and progressive disease for the predicted radiosensitive and nonradiosensitive patients. According to TCGA, new tumor event is defined as metastatic, recurrent, and new primary tumor after initial treatment. Treatment response measures success of outcome at the completion of additional treatment. In current data, progressive disease group includes 78 patients. Non-progressive group includes complete response (127 patients), partial response (4 patients), and stable disease (9 patients). The results were summarized in Figure 3(a) for new tumor event and in Figure 3(b) for progressive disease. The results suggest that the predicted radiosensitive patients who received radiotherapy have a significant lower rate of new tumor event and disease progression. These results are consistent with the results derived from the above survival analysis, and further validated our prediction.
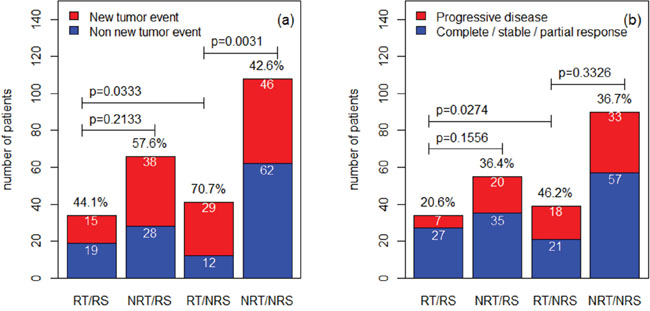
Figure 3: The comparisons among different groups for the rate of new tumor event and progressive disease. The rates for different groups are compared by Fisher exact test. RT: radiotherapy; NRT: nonradiotherapy; RS: radiosensitive; NRS: nonradiosensitive.
Associations between radiosensitivity and clinical factors
For the predicted radiosensitive and nonradiosensitive patients, we performed an analysis to test the association between predicted sensitivity and clinical factors, by both univariate and multivariable analysis. Supplementry Table 2 summarizes the results. Univariate and multivariable analysis both suggested that only histologic type significantly associates with predicted radiosensitivity. We performed strata analysis under LMS, UPS and other histologic types, respectively. Log-rank tests suggested that the predicted radiosensitive patients in the radiotherapy group had better survival compared with non-radiotherapy group, no matter which histologic types they were (Figure 4(4a, 4c, 4e)). For nonradiosensitive patients, radiotherapy might be a potential risk factor, although log-rank tests did not suggest a significant difference (Figure 4(4b, 4d, 4f)).
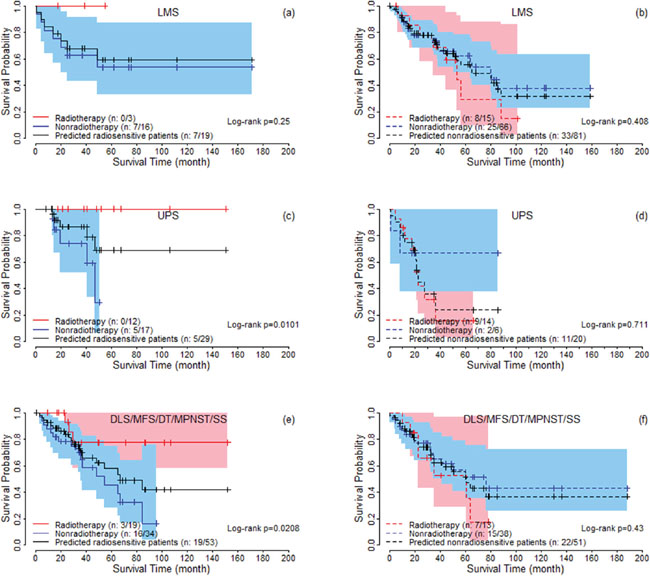
Figure 4: The survival curves under radiotherapy and nonradiotherapy for predicted radiosensitive and nonradiosensitive patients with different histologic types. For DLS, MFS, MPNST, and SS, the proportion of predicted radiosensitive and nonradiosensitive are very similar and the sample sizes are also small for these groups. Therefore, they are combined together for logrank test (Figure 4e and 4f).
In addition, for patients who received radiotherapy, we compared the total dose for predicted sensitive (n=28) and nonsensitive patients (n=39) with available records. The medians of total dose (interquartile range) are 6300(6000-6420) and 6300 (6000-7010) for the two groups. There is no significant difference between the two groups with p value 0.1933 by Wilcoxon test. Moreover, there are 30 and 33 patients who received radiotherapy on primary tumor field for predicted radiosensitive and nonradiosensitive groups, respectively. There is no significant different between the distribution of radiation therapy site. The radiotherapy type is all external radiotherapy. These results suggest that total dose, radiation therapy site, and radiotherapy type are not a confound factor on the sensitivity prediction.
Gene signature and cluster analysis
We further extracted the expression pattern of the selected 26 genes to perform hierarchical clustering analysis by using R packages pheatmap. The results are presented in Figure 5. All of the patients were classified into two groups according to a hierarchical cluster analysis. The blue and yellow bar denoted the predicted radiosensitive and nonradiosensitive patients, respective. We can see that the predicted radiosensitive and nonradiosensitive patients were well matched with the result of hierarchical cluster based on the selected gene signature. More than 82% predicated radiosensitive and nonradiosensitive patients located on the left and right branch of the dendrogram, respectively. These results further validated our previous prediction.
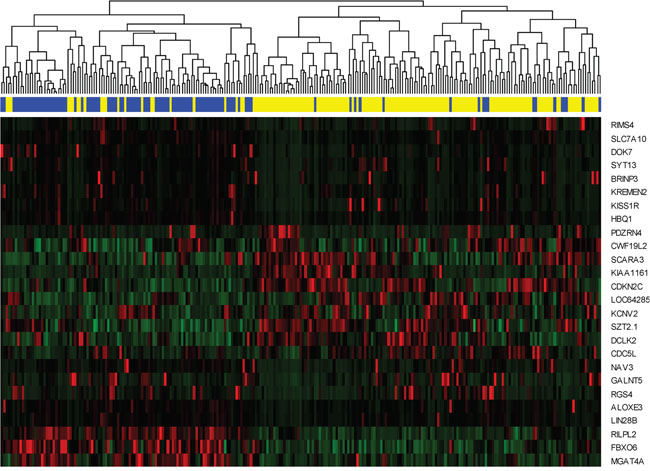
Figure 5: Hierarchical clustering analysis. Hierarchical clustering was used to determine the expression pattern of selected 26 genes. The top blue and yellow bands denote the predicted radiosensitive and nonradiosensitive patients, respectively. Totally, 83 out of 101 predicted radiosensitive patients are classed at the left branch, and 126 out of 152 predicted nonradiosensitive patients are classed at the right branch.
DISCUSSION
Incorporating radiotherapy with novel radiosensitive biomarkers or gene signatures might potentially increase the survival of patients with sarcoma. Although molecular mechanistic studies have shed lights for exploring radiosensitive gene signatures [28, 29], till now, knowledge is still limited about the molecular determinants of tumor radiatiosensitivity in the clinical setting. The inability to understand the fundamental molecular basis for sarcoma sensitivity or resistance to radiation prevents a risk-based clinical trial as well as target driven therapeutic strategies. In addition, due to the large number of genes available for analysis, the development of a reliable diagnostic classifier using early nonrandomized phase II data is often not feasible. Furthermore, validation data might also be limited for the rare sarcoma.
In this article, we followed and extended an adaptive cross-validated procedure to identify sarcoma patients that would be more sensitive to radiotherapy. The whole genome expression data was evaluated by testing the proposed model and new index (nHR). The radiosensitive gene signature including 26 significant genes was found to be predictive of radiosensitive patients. Since, no external validation data exists at this time, we verified our gene signature and sensitivity prediction from the following five aspects: (1) A 10-fold cross validation procedure (a standard validation procedure) to verify the predicted radiosensitive patients. The main results showed that the predicted radiosensitive patients who received radiotherapy had significantly better survival than both the radiosensitive patients without radiotherapy and nonradiosensitive patients who received radiotherapy (Figure 1). (2) After adjusted other clinical factors, multivariate analysis suggested that radiotherapy on the predicted radiosensitive patients was an independent benefit factor (Figure 2). (3) The reduced rate of new tumor event and progressive disease were observed for predicted radiosensitive patients who received radiotherapy, which further provided strong positive evidence for our prediction (Figure 3). (4) Although the histologic type was the only clinical factor strongly associated the predicted radiosensitivity, the survivals of the predicted radiosensitive patients who received radiotherapy were significantly better than radiosensitive patients without radiotherapy, no matter which histologic type they were (Figure 4). (5) The overlap of results from cluster analysis and predicted radiosensitive and nonradiosensitive patients also validated the radiosensitive gene signature (Figure 5). Taken together, these validation results reveal that the identified radiosensitive gene signature is a powerful biomarker for predicting which sarcoma patients would benefit from radiotherapy. Furthermore, the proposed model and cross-validation procedures are an effective approach for developing gene signatures and predicting sensitive patients for cancers beyond sarcoma.
The developed gene signature is easy to apply for predicting new patients. According to the estimation of each genes in gene signature, one just calculate the HR for each gene using the standardized expression value of RNAseq, then compare the product of these HR (nHR) with the threshod 0.035. The patients can be predicted as radiosensitive patients if their nHR less than the threshold.
Our analysis not only developed a radiosensitive gene signature, but also detected genes which may be potentially associated with the molecular basis of sarcoma. For example, LIN28B, might be a potential oncogenic driver for sarcoma. A previous report suggested that LIN28B was involved in a predictive network for osteosarcoma [30]. Emerging evidence indicates that LIN28B is an oncogenic driver in cancer stem cells [31]. LIN28B has been identified to be overexpressed in a wide range of solid tumors and hematological malignancies, such as pancreatic cancer, ovarian cancer, atypical teratoid/rhabdoid tumor, neuroblastoma, oral cancer, et al. [32–38] It might suggest that LIN28B could be a therapeutic target in sarcoma.
KISS1R, which is also on the gene signature list, is a predictive marker for pancreatic cancer, lung cancer, breast cancer, renal cell carcinomas. Patients with KISS1R expression compared to that without expression usually have a favorable prognosis. Targeting the KISS1R signaling axis is considered as a promising strategy to inhibit invasiveness and metastasis [39–44]. However, the possible association among KISS1R and sarcoma has not been reported. RGS4 and SLC7A10 are two important genes directly associated with sarcoma in previous reports [45–47]. Other genes, such as ALOXE3, HBQ1, KREMEN2, SYT13, DOK7, CDC5L, and FBXO6, have been reported in several cancers [48–53]. These results may provide helpful clues for further research in sarcoma.
MATERIALS AND METHODS
Study samples
All data including clinical information and normalized RNAseq expression were downloaded from The Cancer Genome Atlas (TCGA, http://cancergenome.nih.gov/) (update at March 2016). Clinical data is available for 261 patients. Expression data included 259 patients for 20502 genes with clear gene names after removing duplicated patients from raw data with 265 samples. Genes having a maximum expression value of 10 were excluded as they showed almost no expression. Genes with proportion of zero expression more than 75% were also removed. We then standardized the expression data and combined the overall survival and other information together. Next, we merged standardized expression data with clinical information, and removed the patients with missing radiotherapy information. This resulted in 253 patients with 18166 gene expression profiles for the final analysis. Finally, any missing values in clinical data were filled by multiple imputation using the R package mice. The cleaned clinical data are summarized in Table 1.
Methods
Gene signature development
In the present study, the radiosensitive patients are defined as a group of patients who have higher probability of survival if they receive radiotherapy. To develop the patient radioactive sensitive signature for predicting radiosensitive patients, we used the following modeling assumption: there is a subset of S predictive (“sensitive”) genes that significantly interact with radiotherapy. The survival benefit of radiotherapy is associated with these predictive genes through the Cox proportional hazards model:
where is the baseline hazard function; is the effect of radiotherapy; r is an indicator for radiotherapy with 1 indicating radiotherapy and 0 otherwise; b1 to bS are the main effects for these S sensitive genes; i1 to iS are radiotherapy-expression interaction effects that reflect the degree by which the effect of radiotherapy on survival is influenced by the expression levels of sensitive genes.
If the radiotherapy-expression interaction effects are negative, patients who overexpress the sensitive genes will have a higher survival probability under radiotherapy compared with non-radiotherapy. We assume that a fraction of the patient population overexpresses some (but not necessarily all) of the sensitive genes. The total Hazard Ratio (HR) would tend to be less than a preset threshold value (such as less than 0.5). Then, these patients who had a relative high probability of survival are called radiosensitive patients.
Cross-validation procedure
Freidlin and Simon (2005) and Freidlin (2010) developed a novel cross-validated adaptive signature design to identify sensitive patients in clinical trial for binary outcome [24, 25]. Following their framework, we extended and modified this approach to proportional hazards model and applied it to develop radiosensitive gene signature for current sarcoma data. A K-fold cross-validated procedure for gene signature development is described by the following three-step procedure.
Step 1: Training step. Split the data into K parts with the same sample size randomly (usually K = 10). Then, (K – 1) parts are used as training data to fit models and predict the radiosensitive patients in the left-out part (validation data). In the training data, for each gene j, fit a Cox proportional hazards model: . Then, the p values for were used to rank the genes.
Step 2: Prediction step. Use the top significant g genes to build a gene signature, and calculate an index, called nominal HR (nHR) by , for patients in the validation data (k-th part). Here, could be the value averaged over the estimates from g single gene models. Patients in the validation set who has nHR lower than a specified threshold R will be classified as radiosensitive patients.
Step 3 Validation step. Cycling through the above two procedures, and validating on each of the K pieces in turn. Each study patient only appears once in one of the validation data. After the cross validation, each patient is classified as either radiosensitive or not. For radiosensitive patients, Log-rank tests are then performed to test the survival difference between radiotherapy and non-radiotherapy groups at a specified significant level, such as 0.05. A significant test result will indicate radiotherapy is beneficial for radiosensitive patients, then the gene signature is considered effective, and the prediction of radiosensitive patients is accurate.
In the above procedure, there are two key tuning parameters: g and R in the Prediction step. The optimal values of the tuning parameters g and R are usually not known in advance. Therefore, all the possible combinations for g and R could be tried and tested. One can use a nested inner loop of K-fold cross-validation approach on the training data to select the best tuning parameters values without affecting statistical validity of the procedure. An example of such procedure is provided in Supplementary Appendix.
In the above procedure, the 10-fold cross validation is recommended which permits the maximization of the portion of study patients contributing to the development of the diagnostic signature and the minimization of prediction error [54]. Beyond 10-fold cross validation, split sample method and leave-one-out cross-validation (LOOCV) are often mentioned in international validation. As known that split sample method usually provided poor performance on prediction, especially for small sample data. LOOCV could provide similar and stable results, compared with10-fold cross validation. However, LOOCV can be very time consuming to implement [54].
ACKNOWLEDGMENTS
We acknowledge the contributions of the TCGA Research Network. This work was supported by grants from China Scholarship Council, the National Natural Science Foundation of China (81573253), project funded by the Priority Academic Program Development of Jiangsu Higher Education Institutions at Soochow University to ZXT, the National Natural Science Foundation of China (81672743), the fund (2016YFC0904600) from the Chinese Ministry of Science and Technology, NIH R01CA133093, the Alabama Innovation Fund to BX, and was also supported by the research grant: NIH 2 R01GM069430 to NJY.
CONFLICTS OF INTEREST
The authors declare that they have no competing interests.
Author contributions
Study conception and design: ZXT, BX, NJY, MJS
Real data analysis: ZXT, YL, XYZ, QHZ
Drafting of manuscript: ZXT, YL, XYZ, NJY, JLM, BX.
REFERENCES
1. Siegel R, Ma J, Zou Z, Jemal A. Cancer statistics, 2014. CA Cancer J Clin. 2014; 64:9-29.
2. Siegel R, Naishadham D, Jemal A. Cancer statistics, 2013. CA Cancer J Clin. 2013; 63:11-30.
3. Siegel RL, Miller KD, Jemal A. Cancer statistics, 2015. CA Cancer J Clin. 2015; 65:5-29.
4. von Mehren M, Randall RL, Benjamin RS, Boles S, Bui MM, Conrad EU 3rd, Ganjoo KN, George S, Gonzalez RJ, Heslin MJ, Kane JM 3rd, Koon H, Mayerson J, et al. Soft Tissue Sarcoma, Version 2.2016, NCCN Clinical Practice Guidelines in Oncology. Journal of the National Comprehensive Cancer Network. 2016; 14:758-786.
5. Wang D, Abrams RA. Radiotherapy for soft tissue sarcoma: 50 years of change and improvement. American Society of Clinical Oncology educational book. 2014:244-251.
6. le Grange F, Cassoni AM, Seddon BM. Tumour volume changes following pre-operative radiotherapy in borderline resectable limb and trunk soft tissue sarcoma. European journal of surgical oncology. 2014; 40:394-401.
7. Roberge D, Skamene T, Nahal A, Turcotte RE, Powell T, Freeman C. Radiological and pathological response following pre-operative radiotherapy for soft-tissue sarcoma. Radiotherapy and oncology. 2010; 97:404-407.
8. Biswas B, Bakhshi S. Management of Ewing sarcoma family of tumors: Current scenario and unmet need. World journal of orthopedics. 2016; 7:527-538.
9. Levy A, Bonvalot S, Bellefqih S, Vilcot L, Rimareix F, Terrier P, Belemsagha D, Cascales A, Domont J, Mir O, Honoré C, Le Cesne A, Le Péchoux C. Is preoperative radiotherapy suitable for all patients with primary soft tissue sarcoma of the limbs? European Journal of Surgical Oncology. 2014; 40:1648-1654.
10. El-Bared N, Wong P, Wang D. Soft tissue sarcoma and radiation therapy advances, impact on toxicity. Current treatment options in oncology. 2015; 16:19.
11. Davis AM, O'Sullivan B, Turcotte R, Bell R, Catton C, Chabot P, Wunder J, Hammond A, Benk V, Kandel R, Goddard K, Freeman C, Sadura A, et al. Late radiation morbidity following randomization to preoperative versus postoperative radiotherapy in extremity soft tissue sarcoma. Radiotherapy and oncology. 2005; 75:48-53.
12. Dickie CI, Parent AL, Griffin AM, Fung S, Chung PW, Catton CN, Ferguson PC, Wunder JS, Bell RS, Sharpe MB, O'Sullivan B. Bone fractures following external beam radiotherapy and limb-preservation surgery for lower extremity soft tissue sarcoma: relationship to irradiated bone length, volume, tumor location and dose. International journal of radiation oncology, biology, physics. 2009; 75:1119-1124.
13. Strander H, Turesson I, Cavallin-Stahl E. A systematic overview of radiation therapy effects in soft tissue sarcomas. Acta oncologica. 2003; 42:516-531.
14. Yang JC, Chang AE, Baker AR, Sindelar WF, Danforth DN, Topalian SL, DeLaney T, Glatstein E, Steinberg SM, Merino MJ, Rosenberg SA. Randomized prospective study of the benefit of adjuvant radiation therapy in the treatment of soft tissue sarcomas of the extremity. Journal of clinical oncology. 1998; 16:197-203.
15. Pisters PW, O'Sullivan B, Maki RG. Evidence-based recommendations for local therapy for soft tissue sarcomas. Journal of clinical oncology. 2007; 25:1003-1008.
16. Hirst DG, Robson T. Molecular biology: the key to personalised treatment in radiation oncology? The British journal of radiology. 2010; 83:723-728.
17. Chibon F. Cancer gene expression signatures - the rise and fall? European journal of cancer. 2013; 49:2000-2009.
18. Begg AC. Predicting response to radiotherapy: evolutions and revolutions. International journal of radiation biology. 2009; 85:825-836.
19. Salendo J, Spitzner M, Kramer F, Zhang X, Jo P, Wolff HA, Kitz J, Kaulfuss S, Beissbarth T, Dobbelstein M, Ghadimi M, Grade M, Gaedcke J. Identification of a microRNA expression signature for chemoradiosensitivity of colorectal cancer cells, involving miRNAs-320a, -224, -132 and let7g. Radiotherapy and oncology. 2013; 108:451-457.
20. Spitzner M, Emons G, Kramer F, Gaedcke J, Rave-Frank M, Scharf JG, Burfeind P, Becker H, Beissbarth T, Ghadimi BM, Ried T, Grade M. A gene expression signature for chemoradiosensitivity of colorectal cancer cells. International journal of radiation oncology, biology, physics. 2010; 78:1184-1192.
21. Hall JS, Iype R, Senra J, Taylor J, Armenoult L, Oguejiofor K, Li Y, Stratford I, Stern PL, O'Connor MJ, Miller CJ, West CM. Investigation of radiosensitivity gene signatures in cancer cell lines. PloS one. 2014; 9:e86329.
22. Pramana J, Van den Brekel MW, van Velthuysen ML, Wessels LF, Nuyten DS, Hofland I, Atsma D, Pimentel N, Hoebers FJ, Rasch CR, Begg AC. Gene expression profiling to predict outcome after chemoradiation in head and neck cancer. International journal of radiation oncology, biology, physics. 2007; 69:1544-1552.
23. Imadome K, Iwakawa M, Nakawatari M, Fujita H, Kato S, Ohno T, Nakamura E, Ohkubo Y, Tamaki T, Kiyohara H, Imai T. Subtypes of cervical adenosquamous carcinomas classified by EpCAM expression related to radiosensitivity. Cancer biology & therapy. 2010; 10:1019-1026.
24. Freidlin B, Simon R. Adaptive signature design: an adaptive clinical trial design for generating and prospectively testing a gene expression signature for sensitive patients. Clinical cancer research. 2005; 11:7872-7878.
25. Freidlin B, Jiang W, Simon R. The cross-validated adaptive signature design. Clinical cancer research. 2010; 16:691-698.
26. Simon R, Radmacher MD, Dobbin K, McShane LM. Pitfalls in the Use of DNA Microarray Data for Diagnostic and Prognostic Classification. Journal of the National Cancer Institute. 2003; 95:14-18.
27. Fan C, Oh DS, Wessels L, Weigelt B, Nuyten DSA, Nobel AB, van't Veer LJ, Perou CM. Concordance among Gene-Expression–Based Predictors for Breast Cancer. New England Journal of Medicine. 2006; 355:560-569.
28. Greve B, Sheikh-Mounessi F, Kemper B, Ernst I, Gotte M, Eich HT. Survivin, a target to modulate the radiosensitivity of Ewing's sarcoma. Strahlenther Onkol. 2012; 188:1038-1047.
29. Veeraraghavan J, Natarajan M, Herman TS, Aravindan N. Curcumin-altered p53-response genes regulate radiosensitivity in p53-mutant Ewing's sarcoma cells. Anticancer Res. 2010; 30:4007-4015.
30. Di Fiore R, Fanale D, Drago-Ferrante R, Chiaradonna F, Giuliano M, De Blasio A, Amodeo V, Corsini LR, Bazan V, Tesoriere G, Vento R, Russo A. Genetic and molecular characterization of the human osteosarcoma 3AB-OS cancer stem cell line: a possible model for studying osteosarcoma origin and stemness. Journal of cellular physiology. 2013; 228:1189-1201.
31. Zhou J, Ng SB, Chng WJ. LIN28/LIN28B: an emerging oncogenic driver in cancer stem cells. The international journal of biochemistry & cell biology. 2013; 45:973-978.
32. Choi SA, Kim SK, Lee JY, Wang KC, Lee C, Phi JH. LIN28B is highly expressed in atypical teratoid/rhabdoid tumor (AT/RT) and suppressed through the restoration of SMARCB1. Cancer cell international. 2016; 16:32.
33. Helsmoortel HH, De Moerloose B, Pieters T, Ghazavi F, Bresolin S, Cave H, de Vries A, de Haas V, Flotho C, Labarque V, Niemeyer C, De Paepe P, Van Roy N, et al. LIN28B is over-expressed in specific subtypes of pediatric leukemia and regulates lncRNA H19. Haematologica. 2016; 101:e240-244.
34. Hsu KF, Shen MR, Huang YF, Cheng YM, Lin SH, Chow NH, Cheng SW, Chou CY, Ho CL. Overexpression of the RNA-binding proteins Lin28B and IGF2BP3 (IMP3) is associated with chemoresistance and poor disease outcome in ovarian cancer. British journal of cancer. 2015; 113:414-424.
35. Kugel S, Sebastian C, Fitamant J, Ross KN, Saha SK, Jain E, Gladden A, Arora KS, Kato Y, Rivera MN, Ramaswamy S, Sadreyev RI, Goren A, et al. SIRT6 Suppresses Pancreatic Cancer through Control of Lin28b. Cell. 2016; 165:1401-1415.
36. Schnepp RW, Diskin SJ. LIN28B: an orchestrator of oncogenic signaling in neuroblastoma. Cell cycle. 2016; 15:772-774.
37. Schnepp RW, Khurana P, Attiyeh EF, Raman P, Chodosh SE, Oldridge DA, Gagliardi ME, Conkrite KL, Asgharzadeh S, Seeger RC, Madison BB, Rustgi AK, Maris JM, et al. A LIN28B-RAN-AURKA Signaling Network Promotes Neuroblastoma Tumorigenesis. Cancer cell. 2015; 28:599-609.
38. Wang D, Zhu Y, Wang Y, Li Z, Yuan C, Zhang W, Yuan H, Ye J, Yang J, Jiang H, Cheng J. The pluripotency factor LIN28B is involved in oral carcinogenesis and associates with tumor aggressiveness and unfavorable prognosis. Cancer cell international. 2015; 15:99.
39. Uno M, Kokuryo T, Yokoyama Y, Senga T, Nagino M. alpha-Bisabolol Inhibits Invasiveness and Motility in Pancreatic Cancer Through KISS1R Activation. Anticancer Res. 2016; 36:583-589.
40. Cvetkovic D, Babwah AV, Bhattacharya M. Kisspeptin/KISS1R System in Breast Cancer. Journal of Cancer. 2013; 4:653-661.
41. Zhu C, Takasu C, Morine Y, Bando Y, Ikemoto T, Saito Y, Yamada S, Imura S, Arakawa Y, Shimada M. KISS1 Associates with Better Outcome via Inhibiting Matrix Metalloproteinase-9 in Colorectal Liver Metastasis. Annals of surgical oncology. 2015; 22:S1516-1523.
42. Sun YB, Xu S. Expression of KISS1 and KISS1R (GPR54) may be used as favorable prognostic markers for patients with non-small cell lung cancer. International journal of oncology. 2013; 43:521-530.
43. Goertzen CG, Dragan M, Turley E, Babwah AV, Bhattacharya M. KISS1R signaling promotes invadopodia formation in human breast cancer cell via beta-arrestin2/ERK. Cellular signalling. 2016; 28:165-176.
44. Chen Y, Yusenko MV, Kovacs G. Lack of KISS1R expression is associated with rapid progression of conventional renal cell carcinomas. The Journal of pathology. 2011; 223:46-53.
45. Davidson B, Abeler VM, Hellesylt E, Holth A, Shih Ie M, Skeie-Jensen T, Chen L, Yang Y, Wang TL. Gene expression signatures differentiate uterine endometrial stromal sarcoma from leiomyosarcoma. Gynecologic oncology. 2013; 128:349-355.
46. Yang Z, Chen Y, Fu Y, Yang Y, Zhang Y, Chen Y, Li D. Meta-analysis of differentially expressed genes in osteosarcoma based on gene expression data. BMC medical genetics. 2014; 15:80.
47. Aguilar B, Choi I, Choi D, Chung HK, Lee S, Yoo J, Lee YS, Maeng YS, Lee HN, Park E, Kim KE, Kim NY, Baik JM, Jung JU, Koh CJ, Hong YK. Lymphatic reprogramming by Kaposi sarcoma herpes virus promotes the oncogenic activity of the virus-encoded G-protein-coupled receptor. Cancer research. 2012; 72:5833-5842.
48. Andreotti G, Koutros S, Berndt SI, Hughes Barry K, Hou L, Hoppin JA, Sandler DP, Lubin JH, Burdette LA, Yuenger J, Yeager M, Beane Freeman LE, Alavanja MC. The Interaction between Pesticide Use and Genetic Variants Involved in Lipid Metabolism on Prostate Cancer Risk. Journal of cancer epidemiology. 2012; 2012:358076.
49. Borgan E, Lindholm EM, Moestue S, Maelandsmo GM, Lingjaerde OC, Gribbestad IS, Borresen-Dale AL, Engebraaten O, Sorlie T. Subtype-specific response to bevacizumab is reflected in the metabolome and transcriptome of breast cancer xenografts. Molecular oncology. 2013; 7:130-142.
50. Dun X, Jiang H, Zou J, Shi J, Zhou L, Zhu R, Hou J. Differential expression of DKK-1 binding receptors on stromal cells and myeloma cells results in their distinct response to secreted DKK-1 in myeloma. Molecular cancer. 2010; 9:247.
51. Jahn JE, Coleman WB. Re-expression of tumorigenicity after attenuation of human synaptotagmin 13 in a suppressed microcell hybrid cell line. International journal of oncology. 2008; 32:441-449.
52. Fitzgerald LM, Browne EP, Christie KD, Punska EC, Simmons LO, Williams KE, Pentecost BT, R MJ, Otis CN, Arcaro KF. ELF5 and DOK7 regulation in anti-estrogen treated cells and tumors. Cancer cell international. 2016; 16:8.
53. Janoueix-Lerosey I, Novikov E, Monteiro M, Gruel N, Schleiermacher G, Loriod B, Nguyen C, Delattre O. Gene expression profiling of 1p35-36 genes in neuroblastoma. Oncogene. 2004; 23:5912-5922.
54. Molinaro AM, Simon R, Pfeiffer RM. Prediction error estimation: a comparison of resampling methods. Bioinformatics. 2005; 21:3301-3307.