
INTRODUCTION
Lung cancer is one of the main causes of death worldwide [1–3]. There are two major lung cancer histological types: small cell lung cancer (SCLC) and non-small cell lung cancer (NSCLC); the latter comprising three subtypes: adenocarcinoma, squamous cell carcinoma (SQCC) and large cell lung carcinoma [4–6]. Approximately 20% of lung cancers are SQCC, and survival rates for lung SQCC remain low. Development of therapies for this tumor type is thus a major research objective [2].
In the last decade, the introduction of next-generation sequencing aided the detailed description of the lung cancer mutational profile. A variety of agents that target EGFR (epidermal growth factor receptor), ALK (anaplastic lymphoma kinase), or ROS1 (c-ros oncogene 1) have improved the outcome of lung cancer patients bearing specific driver mutations. These studies also provided a list of less frequent potential driver mutations, which could be relevant in a proportion of patients; a number of trials are currently testing new molecularly targeted compounds [2–9]. For NSCLC, however, effective targeted therapies have mainly improved treatment of adenocarcinoma [2]. The SQCC mutational profile is complex and distinct from other NSCLC. The most frequent alterations found are TP53, NFE2L2, KEAP1, several genes involved in squamous cell differentiation, CDKN2A, RB1, FGFR1 amplifications, and other mutations at low frequencies; the class IA phosphoinositide 3-kinase (PI3K) is also deregulated in SQCC [4, 8, 10, 11].
PI3K are dimers formed by a catalytic subunit (p110α, p110β or the hematopoietic isoform p110δ, encoded by PIK3CA, CB, and CD) and a regulatory subunit (p85α, p85β, or the muscle-specific p55γ isoform, encoded by PIK3R1, R2, and R3, respectively) [12, 13]. PI3K catalyzes the formation of phosphatidylinositol (PI) 3,4,5-trisphosphate (PIP3), which activates a signaling cascade that involves protein kinase B (PKB o Akt), the target of rapamycin (TOR), etc; PIP3 levels are downregulated by the phosphatase PTEN. PI3K activation induces cell survival and contributes to promote cell cycle progression, cell migration and the cancer-associated metabolic switch [12, 13, 14]. Alterations in the PI3K pathway in SQCC include amplification of PIK3CA (3q.26.3), PIK3CB (3q.22.3) and PIK3R2 (19q13.2-4) [10, 11, 14]. PIK3CA is altered in 15% of SQCC samples, and PTEN defects are found at similar frequency [8], making PI3K a promising candidate for targeted therapy.
Despite the immense effort to implement PI3K/Akt/mTOR inhibitors for clinical treatment of solid tumors, the results in some cases showed limited efficacy [15]. For NSCLC, the recently reported results for a clinical trial using the PI3K inhibitor buparlisib (a class I pan-PI3K inhibitor) showed that tumor responses were only found in 3% of SQCC and non-squamous NSCLC patients (selected to exhibit activation of PI3K pathway) [16, 17]. Treatment with these inhibitors often triggers ablation of inhibitory feedback pathways and activation of other receptors that cause pathway rebound and resistance [14, 15, 18–23].
In addition to PTEN mutation, or PI3KCA/CB amplification, PI3K activity is enhanced by mutations or deregulated expression of its regulatory subunits. We previously shown that p85β and p85α have non-redundant functions, a distinct subcellular localization, and a different pattern of expression in normal and transformed cells, p85α is more abundant in normal cells, whereas p85β levels is enhanced in melanoma, breast and colon cancer [24, 25]. p85β exhibits a higher affinity for the enzyme substrate (PI4,5P2); in addition, whereas p85α fully inhibits the activity of associated p110 and functions as a tumor suppressor, p85β/p110 show a residual activity in the absence of growth factors; in addition, p85β exhibits oncogenic activity [24, 26]. Although p85β overexpression accelerated tumor progression in the mouse [24], it was unknown whether depletion of p85β in an already developed tumor might induce tumor regression. Here we show that PIK3R2 expression is increased in human lung SQCC, and its depletion induced SQCC tumor regression, supporting development of PIK3R2 interfering tools as a therapy for lung SQCC.
RESULTS
Human lung squamous cell carcinoma cell lines express high PIK3R2 levels
The PI3K p85 regulatory subunit binds, stabilizes and induces activation of the p110 catalytic subunit [27]. Normal cells express higher levels of PIK3R1 (which encodes p85α) than of PIK3R2 (p85β) [24, 28, 29]; in contrast, metastatic melanoma, invasive breast cancer and advanced colon carcinoma show a marked increase in PIK3R2 expression, which correlates with tumor grade [24, 25]. Analysis of gene expression data shows that PIK3R2 expression is also frequently enhanced in lung SQCC (Figure 1A) [www.oncomine.org, Ref. 30][also Ref. 31–33].
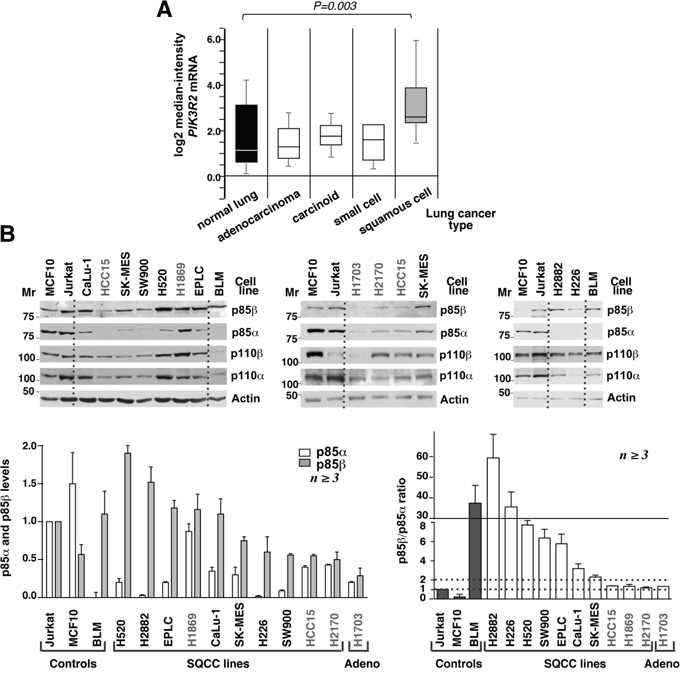
Figure 1: Human lung squamous cell carcinoma cell lines express high PIK3R2 levels. A. Comparison of PIK3R2 mRNA expression in different lung cancer types (ref. 4, Bhattacharjee at al, 2001; www.oncomine.org). The study included 17 samples of normal lung, 132 adenocarcinomas, 20 lung carcinoids tumor, 6 small cell carcinomas and 21 lung SQCC. Data shown as mean ± SD, Student’s t test. B. Cell lines were maintained in exponential growth, lysed, and lysates adjusted for equal protein loading. Extracts (50 μg) were resolved in SDS-PAGE and examined in western blot (WB) using the indicated antibodies. Mr, relative mobility. p85β signals in the different lanes were measured, normalized to the loading control and compared to the p85β signal in Jurkat cells considered 1; p85α signals was examined similarly and compared to the signal in Jurkat cells, also considered 1 as these cells contain comparable amounts of p85α and p85β. Graph (bottom left) shows the mean ± SEM of p85α and β signal normalized for that of Jurkat cells. To define the excess of p85β compared to p85α, we calculated the p85β/p85α signal intensity ratio (each compared to that of Jurkat cells). Graph at the bottom right shows the mean ± SEM of p85β/p85α ratios; SQCC lines with ratios <2 are in grey. Dashed lines indicate p85β/p85α ratios of 1 and 2.
We tested whether the increase in PIK3R2 levels was also observed in lung SQCC cell lines and translates into enhanced p85β protein expression. We determined p85α and p85β levels as well as those of p110α and p110β catalytic subunits in ten lung SQCC cell lines (described in Supplementary Table S1). As controls, we used an adenocarcinoma line (H1703), a normal epithelial cell line (MCF10), and an advanced melanoma cell line (BLM) with increased p85β expression [25]. In addition, we included the human T cell lymphoblastoid Jurkat cell line (JK), which contains similar levels of p85α and p85β [29]. We gave a value of 1 to the signal intensity of p85α and of p85β in JK cell lanes, and refer the signal intensity of the different lines to that of JK cells (considered 1). In addition, we determined the relative p85β/α content by calculating their ratio in each cell line compared to that of JK cells (which has a ratio of 1).
SQCC lines expressed p110α and p110β isoforms; since p85 protects p110 from degradation [27], cells with higher p85 levels also had increased p110 levels (Figure 1A). In the case of regulatory subunits, MCF10 epithelial cells had higher p85α than p85β levels; the H1703 adenocarcinoma, and three of the ten SQCC lines (HCC15, H1869, H2170) had similar p85α and p85β levels; the remaining seven SQCC lineshad higher levels of p85β, with p85β/p85α ratios varying from 2 to >10 (Figure 1B). Thus, both lung SQCC tumors and more than 50% of the SQCC cell lines preferentially expressed PIK3R2.
PIK3R2 depletion reduces PI3K pathway activation in lung SQCC cells
The expression of p85β/p110α complexes in NIH3T3 cells enhances basal PI3K pathway activation (in the absence of growth factors) [24]. Considering that SQCC shows greater p85β levels compared to p85α, we tested the result of reducing PIK3R2 expression on PI3K pathway activityin two representative SQCC cell lines, H226 (p85β/p85α ratio >10) and CaLu-1 (p85β/p85α ratio ~3). We cloned a short hairpin PIK3R2-specific sequence in an inducible lentiviral vector (pLKO-TetON) and obtained stable clones that expressed PIK3R2 shRNA after doxycycline induction (72 h) (Figure 2). Cells were examined in exponential growth, after serum starvation (2 h), and after 30 or 60 min stimulation with serum. The majority of the regulatory form in H226 cells is p85β, and its depletion moderately reduced p110β and p110α levels; this effect was not as evident in CaLu-1 cells, which suggests that the remaining p85α in these cells is sufficient to stabilize p110 (Figure 2).
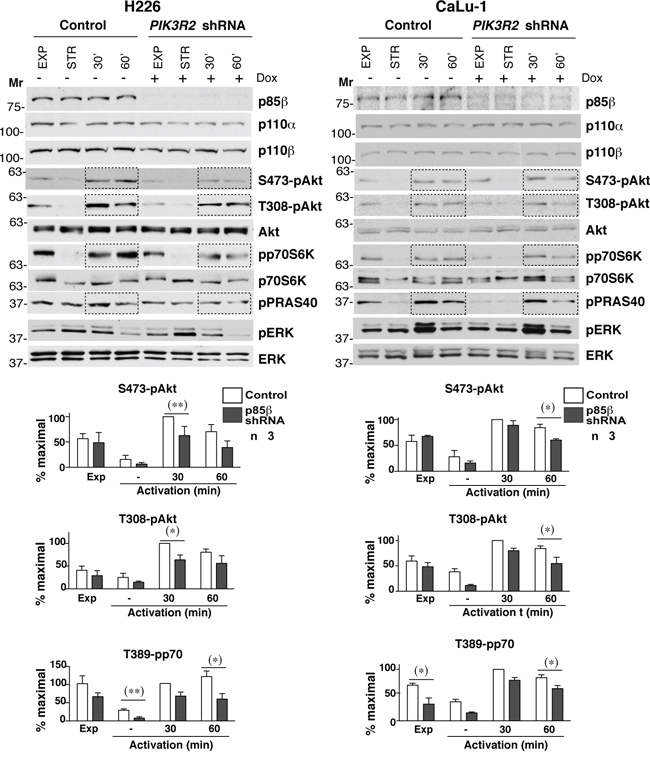
Figure 2: PIK3R2 depletion reduces PI3K pathway activity in CaLu-1 and H226 lung SQCC cell lines. CaLu-1 or H226 cells expressing inducible PIK3R2 shRNA were cultured alone or with doxycycline (2 μg/ml, 72 h); extracts were examined in WB. Mr indicates relative mobility. Graphs show the percent of maximal S472-pAkt, T308-pAkt and T389-pp70S6K signal, normalized to Akt or p70S6K and compared to the control cell signal at 30 min post-stimulation, considered 100%. * P<0.05; ** P<0.01; Student’s t test.
To determine the activation state of PI3K pathway, we examined phospho-Akt (pS473-and pT308-Akt) levels, the Akt substrate PRAS40 (pT246-PRAS40) and the mTOR substrate p70S6K (pT389-p70S6K); we also examined the MAPK pathway status (T202/T204-pErk). In H226 cells, PIK3R2 depletion reduced pAkt, pPRAS40 and p70S6K, with no notable effect on pErk (Figure 2). In CaLu-1 cells, pAkt levels were lower than in H226 cells; nonetheless, PIK3R2 knockdown also reduced pS473-Akt, pT308-Akt, pPRAS40 and pT389-p70S6K levels, mainly at 1 h post-activation (Figure 2).
In a similar assay, PIK3R1 silencing did not markedly affect pErk levels (a moderate reduction was seen in H226). In addition, p85α depletion reduced p110β and p110α levels in both cell lines (more clearly in CaLu-1), which suggests that p85α more effectively protects p110 from degradation than p85β; activation of most PI3K effectors were either unaffected (pPRAS40) or increased (T308-pAkt, T389-pp70S6K) after p85α depletion (Supplementary Figure S1), with the exception of S473-pAkt in CaLu-1 cells, which appeared to require both p85β and p85α expression for optimal S473-pAkt phosphorylation (Figure 2). This finding might be explained by the p85α contribution to p110 stability. The increased activation of the remaining PI3K effectors after PIK3R1 silencing, despite reduction of p110 levels, suggests that p85α depletion causes enrichment in p85β/p110 complexes (Figure 2), which enhance PI3K activation [24]. These observations show that p85β is the main regulatory isoform that mediates PI3K pathway activation in H226 and CaLu-1 lung SQCC cells.
PIK3R2 depletion triggers SQCC apoptosis and xenograft regression
In breast and colon cancers PIK3R2 overexpression correlates with tumor grade [24]. As PIK3R2 expression is increased in SQCC tumors, we postulated that interference with PIK3R2 in an established SQCC tumor would halt tumor progression. To examine the effect of reduced PIK3R1 or R2 expression in lung SQCC tumor xenografts, we infected different cell lines with an inducible lentiviral vector that encodes a short hairpin specific for PIK3R1 or R2; stable clones expressed these shRNA after doxycycline induction. We optimized protocols for xenografts of the different cell lines in immunodeficient mice (see Methods); as controls we used SQCC cell lines expressing the pLKO empty vector (doxycycline-treated) or cell lines expressing PIK3R1/2 shRNA (without doxycycline).
We first tested the effect of PIK3R1 silencing on the growth of tumor xenografts derived from H226, H520, and CaLu-1 cells with p85β/p85α ratios >2. In response to doxycycline, the cells showed reduced PIK3R1 levels, although this treatment did not significantly reduce tumor size (Figure 3A; Supplementary Figure S2A). We also analyzed the consequences of PIK3R2 depletion in tumors of cells with a p85β/p85α ratio of ~1. In HCC15, H2170, PIK3R2 depletion did not affect tumor size (Figure 3B; Supplementary Figure S2B). H1869 cells were resistant to lentiviral infection and could not be examined.
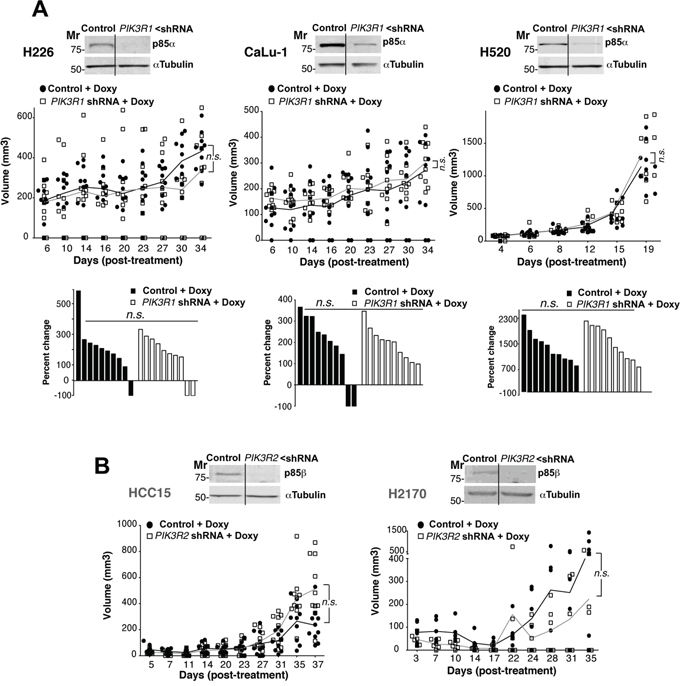
Figure 3: PIK3R1 depletion does not trigger lung SQCC xenograft regression. A. H226, CaLu-1 and H520 lung SQCC cell lines expressing inducible PIK3R1 shRNA were cultured (72 h) and extracts examined in WB to confirm PIK3R1 shRNA efficiency. Cell lines were expanded in culture and injected subcutaneously into scid/scid mice (~107 cells in 100 μl PBS plus 100 μl matrigel). Graph (top) illustrates the size of each tumor at different times after initiation of treatment; n.s., not significant, two-way ANOVA test. Graph (bottom) shows percent change in size from beginning to end of treatment; n.s., not significant, Chi square test. Mr, relative mobility. B. Lung SQCC cell lines SK-MES and EPLC, with similar p85β and p85α levels, were infected with viruses encoding inducible control or PIK3R2 shRNA; clones were selected and xenografts established in scid/beige as above. We compared tumor growth after doxycycline addition to drinking water. In WB, we tested PIK3R2 shRNA efficiency in reducing p85β levels. The graph indicates the size of each tumor at different times after initiation of treatment. Differences between control and treated tumors was analyzed using a 2-way ANOVA test; n.s., not significant.
We next analyzed the effect of depleting PIK3R2 in tumor xenografts from lung SQCC cells with preferential PIK3R2 expression. Seven of the ten SQCC cell lines exhibited increased expression of PIK3R2. All of them were analyzed, except for SW900 cells, which showed extremely low division rates that made it difficult to select clones expressing PIK3R2 shRNA. We detected two types of response after PIK3R2 depletion, tumors derived from four lines were almost completely eliminated (H2882, H520, H226, CaLu-1; Figure 4A, Supplementary Figure S3A), whereas tumor from the other two lines (SK-MES-1, EPLC-272H) showed reduced growth, although the response was not as marked (Figure 4B, Supplementary Figure S3B). The response to PIK3R2 depletion was detected in SQCC cell lines with predominant PIK3R2 expression, but it was not proportional to the p85β/p85α ratio, and did not correlate with PTEN, KRAS or PIK3CA mutation or with higher PIK3CA or PIK3CB expression (Figure 4, Supplementary Table S2). For SK-MES-1 and EPLC, results were similar in scid/scid mice and scid/beige mice, which lack NK cells [34] (Figure 4), excluding an effect of NK cells in the responses.
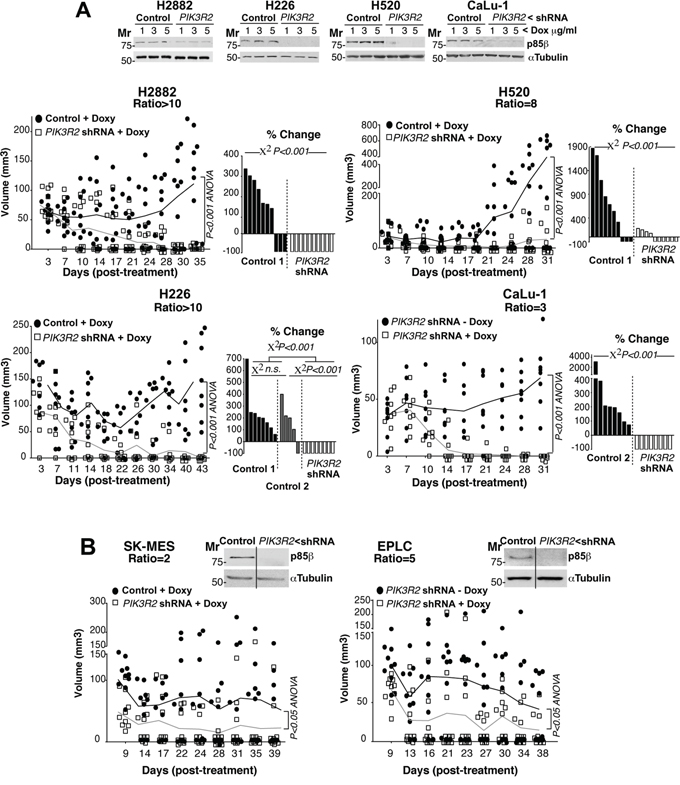
Figure 4: PIK3R2 depletion induces SQCC xenograft regression. A, B. Lung SQCC cell lines expressing inducible PIK3R2 shRNA were cultured (72 h) at indicated doxycycline concentrations. Sample extracts were examined in WB to confirm PIK3R2 shRNA efficiency in reducing p85β levels (top). Cell lines were expanded in culture and injected subcutaneously into scid/beige mice (~107 cells in 100 μl PBS plus 100 μl matrigel). Tumors developed for several days until they reached ~50 mm3; we then included doxycycline (2 mg/ml) in drinking water and measured tumor size three times/week. We compared tumor growth after doxycycline addition to drinking water. As a control, we used tumors generated with cell lines expressing empty vector and treated with doxycycline (control 1) or generated with cell lines expressing inducible PIK3R2 shRNA with no doxycycline (control 2); both controls gave comparable results. Graphs in A, (left) and B) indicate the size of each tumor at different times after treatment. Differences between control and treated mouse tumors were analyzed with a 2-way ANOVA test. Graphs in A, (right) show percent change in tumor size, comparing the final with initial tumor size (pre-treatment). We compared groups using the Chi square test.
To examine the effect of reducing PIK3R2 levels at a cellular level, we prepared a set of xenografts from H226 and CaLu-1 cells and mice were sacrificed at experiment midterm, when the tumor size began to diminish. Histological examination of these tumor samples showed a low mitotic index (Figure 5, red arrows), which was even lower after PIK3R2 depletion. Few apoptotic figures were observed in control or PIK3R1 shRNA-treated tumors, and were numerous in PIK3R2-depleted tumors (Figure 5). Immunostaining of Ki-67+ and active caspase 3 in control, PIK3R1 and PIK3R2 shRNA-treated samples showed a lower number of dividing cells and a larger number of apoptotic cells after PIK3R2 shRNA treatment (Figure 5). These results indicate that PIK3R2 depletion in SQCC lines decelerates cell growth and induces cell death.
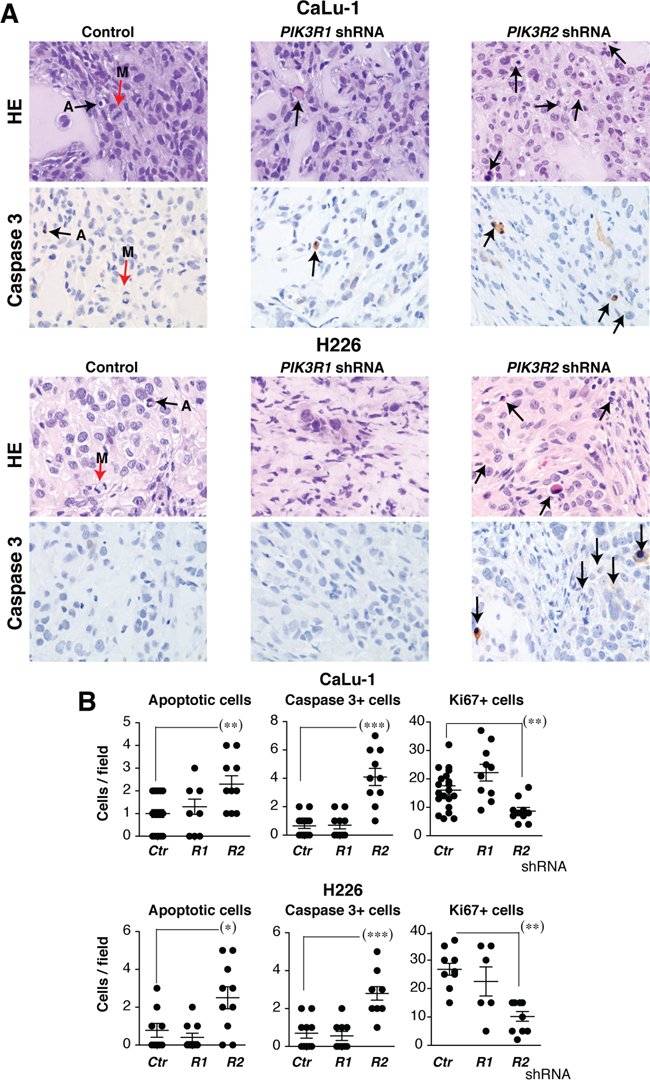
Figure 5: PIK3R2 depletion induces cell death in SQCC xenografts. Tumor xenografts were obtained using H226 and CaLu-1 cells, expressing inducible PIK3R1 or PIK3R2 shRNA. When tumors reached ~50 mm3, mice were treated with doxycycline in drinking water (2 mg/ml). Mice were sacrificed when tumors size began to diminish. A. Histological examination of representative tumors and staining of active caspase 3 in control, p85α and p85β shRNA-treated samples (40x). Arrows show mitotic (M) and apoptotic cells. B. Graphs show the number of apoptotic, caspase 3+ or Ki-67+ cells per field (40x) in tumors treated with indicated shRNA. *** P <0.001; ** P<0.01; * P <0.05; Student’s t test.
In one of the cell lines, we tested whether rescue of p85β expression restores tumor growth; we also tested the efficacy of a prolonged treatment. We used CaLu-1 cells expressing doxycycline-inducible PIK3R2 shRNA. In this assay, we allow the tumors to grow until ~100mm3, when we then began the treatment with doxycycline in the drinking water (2 mg/ml). The tumor size reduction was slower than when treating smaller tumors (Figure 6A ~100mm3 versus Figure 4A ~50 mm3 tumors), which suggests that accessibility to doxycycline in big tumors might be suboptimal and the treatment reduced tumor size more gradually. At ~1 month of treatment, most of the tumors were very small; animals were randomly divided in two groups, one was maintained and the other deprived of doxycycline. All the tumors maintained with doxycycline remained small for another month, although they show a slow but continuous moderate increase in size (Figure 6A). Among tumors deprived of doxycycline we detected two clearly distinct behaviors, one set remained small and behaved similarly than tumors maintained in doxycycline, whereas the other set grew at significantly higher rates and sizes (Figure 6A). The tumors with a marked regrowth index corresponded to those that restored p85β expression, while the set of tumors with moderate growth expressed very low p85β levels (Figure 6B). These results suggest that tumors remain responsive after a two-month treatment, although p85β depletion is not sufficient for a complete and stable tumor disappearance. In addition, restoration of p85β expression, results in marked tumor regrowth (Figure 6A,B).
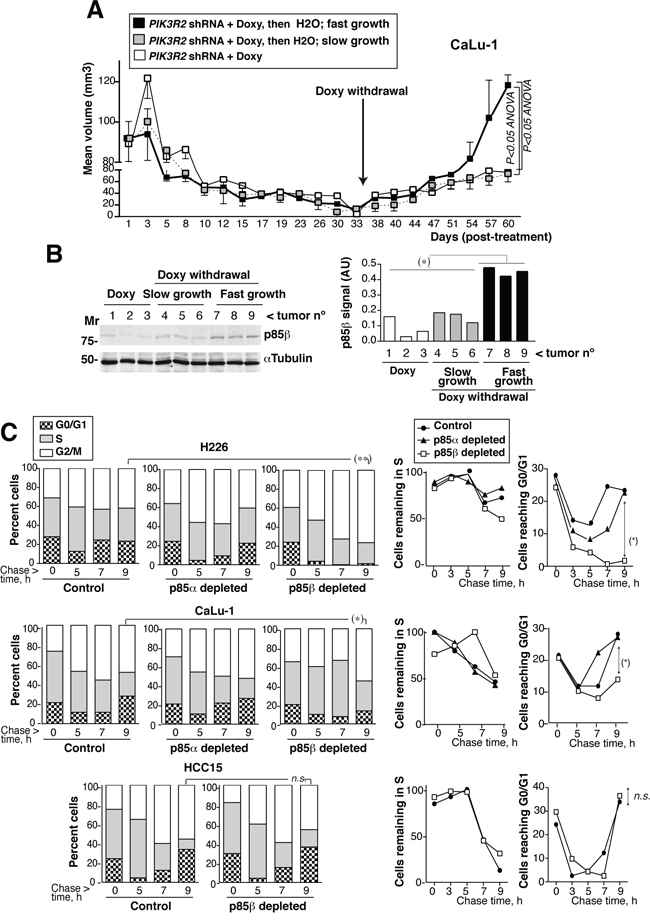
Figure 6: PIK3R2 reconstitution restores SQCC xenograft growth; PIK3R2 depletion decelerates cell cycle progression. A. Xenografts were established using CaLu-1 cells expressing inducible-PIK3R2 shRNA. When tumors reached a volume ~100 mm3, mice were treated with doxycycline for ~one month, when we randomly divided the animals in two groups. Doxycycline was withdrawn in one of the groups and maintained in the other. Graph shows the Mean ± SEM size of tumors kept in doxycycline (white square) as well as those deprived of the treatment, which were divided in slow- (grey) or fast-growing tumors (black). Differences between groups were analyzed using a 2-way ANOVA test. B. WB confirmed p85β re-expression in fast growing tumors and p85β low levels in the slow-growth tumors. Graph shows p85β signal intensity (corrected for the loading control) in arbitrary units (A.U.). Mr. indicates relative mobility. C. CaLu-1 or H226 cells expressing control, PIK3R1 or PIK3R2 shRNA were cultured alone or with doxycycline (5 μg/ml, 72 h). A non-responsive cell line (HCC15, control) expressing PIK3R2 shRNA was treated similarly. Cells were labeled with BrdU (20 μM, 1h; 90 min in the case of H226) then deprived of BrdU and chased at different times. We examined the percentage of BrdU+ cells that progressed from 2N (G0/G1) to 2-to-4N (S) and to 4N DNA content (G2/M phases) by flow cytometry (Mean percentage, n = 3)(left panels). In the medium panel, we represent the proportion of cells remaining in S phase at different times compared to maximal, considered 100%. Right panels show the percentage of cells in G0/G1 at different times. *P<0.05, differences between cell cycle distribution were examined using Chi square test; percent of S or G0/G1 cells was compared using Student’s t test.
In conclusion, PIK3R2 depletion reduced growth of all SQCC tumors with enhanced p85β levels and was sufficient to trigger tumor regression in the six SQCC lines with this phenotype (Figure 4). Shrinkage of SQCC-derived tumors supports development of an approach aimed to decrease PIK3R2 action for the treatment of SQCC.
PIK3R2 depletion decelerates cell cycle progression
We also examined the effect on cell cycle progression of depleting PIK3R2 in responsive (H226 and CaLu-1) and non-responsive (HCC15) cells. We BrdU-labeled newly synthesized DNA in exponentially growing cells, remove BrdU and collected the cells at various time points after BrdU deprivation (chase), to follow progression of BrdU+ S phase cells through cell cycle. This method permits examination of cell cycle in asynchronous cultures since tumor cells are difficult to synchronize in G0/G1 phases. The proportion of H226 cells labeled with BrdU during the 90 min pulse period was similar in control and PIK3R1-depleted cells but was approximately 30% lower in PIK3R2-depleted cells, supporting a slower G0/G1 transition to S phase. In addition, whereas the majority of control H226 cells made the S> G2/M transition similarly than PIK3R1-depleted cells and exited from G2/M to G0/G1 similarly (moderately faster in the case of control), PIK3R2-depleted cells entered G2/M and were accumulated in this phase without showing progression to G0/G1 phase at ~ 9h (Figure 6C). H226 cells have a p85β/p85α ratio >10; this behavior might reflect the need of a p85 molecule to complete cytokinesis [35]. In CaLu-1 cells (with a p85β/p85α ratio of ~3), cells were not sequestered in G2/M phase, possibly due to the presence of p85α; nonetheless, PIK3R1 depletion moderately accelerated and PIK3R2 depletion significantly decelerated cell cycle progression, as estimated by the rate of S phase exit and return to G0/G1 phases (Figure 6C). PIK3R2 depletion did not affect S to G2/M transition, or exit from G2/M to G0/G1 in HCC15 cells (Figure 6C). This shows that p85β depletion selectively decelerates cell cycle progression in PIK3R2 shRNA sensitive cells.
PIK3R2 depletion does not induce PI3K pathway rebound
To analyze the status of PI3K pathway in shRNA-treated tumors, we tested extracts from control, PIK3R1 and PIK3R2 shRNA-treated-H226, -CaLu-1 and -H520 tumor samples. Depletion of PIK3R2, but not of PIK3R1, reduced pT308-, pS473-Akt, pPRAS40 and pp70S6K levels without notably affecting pErk/Erk levels (Figure 7A). Physiological PI3K activation is followed by induction of negative feedback mechanisms that maintain the transient nature of PI3K activation [12–22]. A major problem of PI3K inhibitor-based therapies is that they also abrogate these feedback inhibitory mechanisms. The combined effect of reducing enzyme as well as feedback pathways activities often results in net pathway reactivation after a few hours [12–22]. In some cases, this effect is observed with p110α inhibitors alone and is corrected by the combined addition of p110α plus p110β inhibitors; in other models, even pan-PI3K inhibitors induce pathway reactivation after long incubation periods [36–38]. Prolonged PIK3R2 shRNA treatment induced stable PI3K pathway inhibition (Figure 7A), which might be the result of a net reduction in PI3K molecules levels that are stabilized by p85, or might indicate that negative feedback pathways do not act in lung SQCC lines. To determine whether PIK3R2 deletion is advantageous compared to PI3K inhibition, we tested whether the inhibitors induce PI3K pathway reactivation after extended treatment. We optimized the dose of these compounds used for short-term inhibition of PI3K effectors; we tested rapamycin, a pan-PI3K inhibitor (Ly294002, Ly), a p110β-specific inhibitor (TGX221, TGX) and a p110α inhibitor (PIK75, PIK) [39]. Rapamycin only inhibited the mTOR substrate pS6K, while PIK and TGX reduced pAkt and pp70S6K levels in a dose-dependent manner (Supplementary Figure S4).
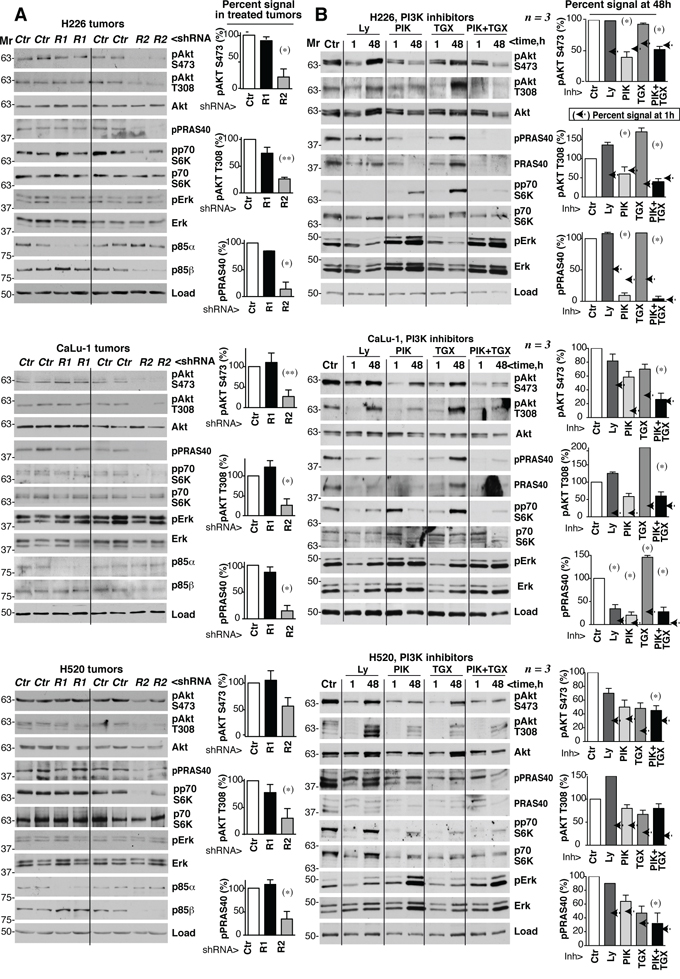
Figure 7: PIK3R2 depletion, but not PI3K inhibitors, induces stable PI3K pathway inhibition. A. Tumor xenografts were obtained using H226, CaLu-1 and H520 lung SQCC cells expressing inducible PIK3R1 or PIK3R2 shRNA. When tumors reached ~50 mm3, mice were treated with doxycycline in drinking water (2 mg/ml); they were sacrificed when tumors began to diminish. Normalized tumor extracts were examined by WB with indicated antibodies. B. H226, CaLu-1 and H520 cells were cultured in exponential growth were incubated with: vehicle (DMSO, 1:103 V:V), Ly294002 (5 μM), PIK75 (200 nM), TGX221 (30 μM), or PIK75 (200 nM) plus TGX221 (30 μM) for the last 1 h of culture or during 48 h; extracts were tested in WB. Mr indicates relative mobility. In both A and B, the pAkt or pPRAS40 signal was measured and normalized to the loading control (Akt or tubulin, respectively), and compared to that in controls (DMSO, considered 100%). Graphs show percentage of signal compared to maximal as mean ± SD at 48h of treatment. Arrows on the right side of bars show the percentage of signal compared to maximal detected after 1h of treatment.* P <0.05; **P <0.01; unpaired Student’s t test with Welch correction.
We tested whether prolonged treatment with Ly, TGX, PIK or a TGX/PIK combination could reactivate PI3K effectors. In H226 cells, treatment with optimal Ly or TGX doses for 48 h increased pAkt and ppPRAS40 levels compared to the 1 h treatment; although PIK or TGX/PIK maintained low pAkt and ppPRAS40 levels after 48 h, they increased total Erk and pErk levels (Figure 7B). In H520 and CaLu-1 cells, all inhibitors failed to restrain the pathway after incubation for 48 h, as estimated by measuring levels of PI3K effectors phosphorylation, which were higher at 48 h compared to 1 h treatment (Figure 7B). In H520 and CaLu-1 cells, we also detected a compensatory increase in pErk and total Erk levels after incubation with PIK and TGX/PIK (Figure 7B). Not all effectors recovered equally in the different treatments and cell lines. For instance, the TGX/PIK combination was more efficient that either inhibitor alone in maintaining low pathway activity, although reactivation was detected at 48 h compared to 1 h in H520 and CaLu-1 cells. Decreased pPRAS40 levels were paralleled by a reduction in PRAS40 cell levels and PIK treatment blocked pS6K phosphorylation less effectively in CaLu-1 than in the other cell lines, but showed longer duration (Figure 7B). Together, in most PI3K effectors examined, we detected an increase in phosphorylated forms after 48 h of incubation compared to 1 h (Figure 7B). In contrast to PIK3R2 depletion, which stably inhibited the PI3K pathway, sustained treatment with PI3K inhibitors resulted in PI3K pathway reactivation.
DISCUSSION
Targeted therapies are improving clinical management of lung adenocarcinoma, however, they have been less efficient for lung squamous cell carcinomas, which make up one-fifth of lung cancers. Increased expression of PIK3R2, which encodes the regulatory subunit p85β, enhances basal PI3K pathway activation and parallels tumor progression in melanoma, colon cancer and breast carcinoma [24, 25]. In the present study, we show that SQCC tumors also exhibit an increased PIK3R2 expression. Moreover, we demonstrate that the interference with PIK3R2 expression in established SQCC xenografts reduces tumor survival. In particular, interference with PIK3R2 expression triggered tumor shrinkage in all the cell lines with predominant p85β expression. PIK3R2 deletion induced cell death and stably inhibited the PI3K pathway, without inducing pathway rebound. Greater sensitivity of some tumors to PIK3R2 depletion was independent of PIK3CA or CB expression levels and of KRAS, PTEN and PIK3CA mutation. These results support the development of therapies oriented to reduce the action of PIK3R2 for lung SQCC.
Progress in whole-genome characterization has allowed generation of comprehensive profiles of genetic alterations in SQCC and identification of new therapeutic targets [2–11]. In addition to targets suggested by specific SQCC somatic DNA modifications, altered expression of WT proteins is also considered for clinical management. This is the case of MET tyrosine kinase receptor overexpression, which was observed in 29% of lung SQCC patients [2, 40]. Immunotherapy is another promising lung cancer treatment [41]. Nonetheless, the poor prognosis of lung cancer, and of SQCC in particular, encourages development of alternative strategies.
One of the most promising targets in oncology is PI3K. PIK3CA copy number gains are present are higher frequencies in SQCC than in lung adenocarcinoma [8]. Expectations are high for PI3K inhibitors in cancer. Nonetheless, although results are encouraging for PI3Kδ inhibitors in some hematopoietic tumors [ 14], the results from a recent clinical trial using buparlisib (a pan-PI3K inhibitor) for NSCLC patients (preselected to exhibit PI3K pathway activation) showed that only 3% (SQCC and non-squamous) responded by reducing tumor size [16, 17]. This is not exceptional, and except for some combined therapies that include PI3K, Akt, mTOR inhibitors, e.g., for breast and prostate cancer subtypes [36, 37, 42], treatment of solid tumors with these inhibitors has been often ineffective [12, 16, 17, 42, 43]. Better patient selection criteria [16] and identification of the pathway rebound and resistance mechanisms [22] have increased interest in combined therapy.
As commented above, deregulated WT gene expression (as is the case of MET receptor) has also been targeted successfully for therapy [2]. Considering that SQCC presents amplification of the chromosome region including PIK3R2, which encodes p85β [10, 11] and the observation that PIK3R2 expression is often increased in clinical SQCC (Figure 1), we proposed that PIK3R2 could be a promising target for lung SQCC. We based this proposal on the previous observation that p85β and p85α exhibit a distinct subcellular localization and a different pattern of expression in normal and transformed cells (p85α is the more abundant isoform in normal cells, whereas p85β expression is enhanced some tumors) [24, 25]. At the molecular level, p85β exhibits higher affinity for the enzyme substrate (PI4,5P2) than p85α, and a lower capacity to restrain p110 activity in the absence of growth factors[24]. In agreement with these features, p85β overexpression but not that of p85α induced cell transformation [24, 44]. Finally, although it was unknown whether depletion of p85β in an already developed tumor might induce tumor regression, pik3r2-deficient mice exhibit reduced colon cancer formation whereas p85β overexpression accelerated tumor progression in the mouse [24]. Here we show that PIK3R2 depletion, but not that of PIK3R1, induced regression of established SQCC tumors exhibiting high PIK3R2 levels (Figure 3 and 4). Several new avenues could be pursued in order to further dissect the differential function of p85α or p85β in cancer. First, the analysis of their differential regulation of the expression, examination of p85α or p85β associated proteins pre- and on-treatment and finally to ascertain the differential protein binding to the N-terminal region (the less conserved region) of each of the two proteins.
PIK3R2 depletion in SQCC tumors with high PIK3R2 expression caused sustained PI3K inhibition without inducing pathway reactivation (Figure 4 and 7), which would reduce the probability of resistance, an important drawback of enzyme inhibitors [13–16, 19–23, 35, 38]. The absence of pathway reactivation might be explained by the elimination after PIK3R2 depletion of one of the targets of the feedback inhibitory pathways, the p85 molecule [38]. In a clinical setting, p85β expression level could potentially be examined in circulating cancer cells. Although tumor response to PIK3R2 depletion required enhanced PIK3R2 expression, the magnitude of the PIK3R2 silencing effect in different tumor cells was not strictly proportional to the p85β expression levels, suggesting that other tumor features modulate this response. Nonetheless, tumor response to PIK3R2 depletion did not require PIK3CA, PTEN or KRAS mutation, and caused shrinkage of all tumors examined with enhanced p85β expression. We show that tumors remain responsive after a two-month treatment, although p85β depletion was not sufficient for a complete and stable tumor disappearance (Figure 6). Rescue of p85β expression, resulted in tumor regrowth.
We have tested the consequences of depleting PIK3R2 only in lung SQCC lines; it is possible that other tumor types showing enhanced PIK3R2 expression at advances phases, such as breast and colon carcinoma or melanoma [24, 25], might also benefit from a therapeutic strategy based on PIK3R2 depletion. One of the alterations found in SQCC is PIK3CA mutation or amplification [8]. Although any of the tested cell lines had PIK3CA mutations (Supplementary Table S2), CaLu-1 cells exhibit a K-Ras mutation that enhances PI3Kα activity [45] and responded to PIK3R2 deletion. Future studies will definitively conclude on whether or not PIK3CA alteration affects p85β-dependence in lung SQCC.
The strength of antisense or interfering RNA gene expression regulators has been demonstrated extensively [46, 47], although their use as therapeutic tools in patients has been hampered by difficulty in delivering the RNA to the tumor; this might be facilitated in tumors accessible by aerosol therapy such as lung SQCC [46, 47]. The use of small molecules that impair p85β/p110 complex formation might also be an alternative; we have developed a FRET-based screening assay to search for such compounds (not shown). Finally, the CRISP-Cas approach, which has been successful in mice [48], might also be useful for PIK3R2 deletion in lung SQCC with enhanced PIK3R2 expression.
p85α:p85β ratios could be examined in the clinic by quantitative PCR since PIK3R2 mRNA levels are proportional to p85 protein content [ref 29]; also, current techniques for gene copy number variation analysis could be applied to identify the SQCC cases with increased PIK3R2 containing region. Additionally, p85α:p85β expression ratio might be examined in patient biopsy samples either by simultaneous analysis of the expression of both proteins by highly specific antibodies to the human proteins or by reverse phase protein analysis (RPPAs) applied to formalin-fixed and paraffin embedded (FFPE) tissue.
Although further technical improvements are needed, several siRNA targets and antisense oligonucleotides are currently under study and hold promise for the incorporation of these therapies for medical applications [49–52]. Their development for PIK3R2 inhibition is justified by the clear potential of PIK3R2 depletion for treatment of lung SQCC tumors as it induced tumor regression without triggering PI3K pathway reactivation.
MATERIALS AND METHODS
Cell culture
We used ten lung squamous cancer cell lines. Seven were purchased from the American Type Culture Collection (CaLu-1 (HTB-54), SK-MES-1 (HTB-58), H1869 (CRL-5900), H520 (HTB182), H2170 (CRL-5928), H226 (CRL-5826), SW900 (ATCC HTB-59) and two from the DSMZ collection (HCC-15 (ACC-496), EPLC-272H (ACC-383)). We also used the NSCLC line NCI-H2882 [53]. As controls, we used a human leukemic T cell lymphoblastoid line (Jurkat, TIB152), a non-tumorigenic breast epithelial cell line (MCF10, CRL10781) and a lung adenocarcinoma cell line (H1703, CRL5889) from the ATCC, and BLM cells [25]. Cell lines were cultured as indicated in Supplementary Table S1.
Antibodies, reagents, cDNAs, western blotting, cell cycle and BrdU pulse/chase
Western blotting (WB) was performed as described [24] using the following antibodies: anti-p110α, -p110β, -phospho(p)-Akt S473, -p-Akt T308, -Akt total, -p-p70S6K T389, -PRAS40, -pERK T202/T204, and -ERK total (from Cell Signaling), anti-p85α (Millipore), anti-p70S6K (Santa Cruz), anti-p-PRAS40 T246 (R&D Systems), anti-α−tubulin (Calbiochem) and anti-β−actin (Sigma). We cloned human PIK3R1 (p85α) or PIK3R2 (p85β) shRNA into the Tet-pLKO-neo plasmid (a gift from Dimitri Wiederschain, Addgene 21916) [54]; shRNA expression from this vector is doxycycline-inducible (Sigma). 293T cells were transfected (JetPei DNA Transfection Reagent) with Tet-pLKO-neo-shp85α, Tet-pLKO-neo-shp85β or empty vector plus pMD2.G plasmid (Addgene 12259) and psPax2 plasmid (Addgene 12260) (48 h). Supernatants containing viral particles were filtered (0.45 μm), supplemented with polybrene (8 μg/ml, Sigma) and added to cells. After two infections, clones were selected in medium plus G418 (Calbiochem). Efficiency of shRNA induction was evaluated in WB; clones with >85% reduction of protein level were selected for in vivo and in vitro assays. PIK75 and TGX221 treatment, cell cycle analysis and BrdU pulse/chase were as described [39].
Tumor xenografts
All procedures using mouse models were approved by the Ethics Committee of the Centro Nacional de Biotecnología (CNB-CSIC) and were carried in accordance with EU and Spanish legislation (RD 53/2013). Approximately 107 cells (stably transfected with shRNA-p85α, -p85β or empty vector) were mixed (50%) with Matrigel (BD) in a total volume of 0.2 ml and were inoculated subcutaneously in the flank of 8-week-old female mice under isofluorane anesthesia. We used the scid/scid mouse strain (BALB/cJHanHsd-Prkdcscid), which develops neither T nor B cells, as well as (in the case of SK-MES and EPLC) the scid/Beige mouse strain (C.B-17/IcrHsd-PrkdcscidLystbg-J), which lacks T, B and NK cells (both strains from Harlan Laboratories).
Tumors developed for 3 to 7 days until the volume of most ranged from 75 to 100 mm3, after which we included doxycycline (2 mg/ml) in mouse drinking water containing 5% saccharose. We weighed mice and measured tumors with calipers twice weekly and calculated volume as V = (smaller side length2 x larger)/2. As endpoints, we established a) loss of 20% of initial weight, b) tumors greater than 1500 mm3 or c) complete loss of treated tumors for two weeks, indicating tumor regression.
Histopathology, immunohistochemical analysis
Tissue samples for histopathology and immunohistochemistry were fixed in 10% buffered formalin, paraffin-embedded, sectioned (4 μm) and hematoxylin/eosin-stained. Indirect immunohistochemical staining was performed on formalin-fixed paraffin-embedded tissue sections, using streptavidin-biotin peroxidase complex [55]. Antibodies used for immunostaining were anti-Ki-67 (1:100; MIB-1, Dako) and -cleaved caspase 3 (1:100; 9661 rabbit IgG; Cell Signalling). Briefly, tissues were deparaffinized and sections hydrated in a graded ethanol series. Endogenous peroxidase activity was quenched with 3% hydrogen peroxide (10 min). In order to retrieve the Ki-67 and cleaved caspase 3 antigens, the tissues were placed in citrate buffer (10 mM, pH 6) or EDTA buffer (0.5 mM, pH=8) for 20 min, and sections were incubated with primary antibody (overnight, 4°C). After rinsing with Tris-buffered saline (TBS), sections were incubated with peroxidase-based EnVision complex (Dako). Peroxidase activity was demonstrated by diaminobenzidine staining. Finally, sections were washed in water, lightly hematoxylin-counterstained, dehydrated and mounted with DPX (distyrene, a plasticizer, and toluene-xylene). For controls, primary antibody was omitted or samples were incubated with an isotype control antibody. The percentage of positive cells were evaluated by scoring 10 randomly selected 40X fields a light microscopy (Nikon Y-THS).
Statistical analyses and in silico studies
PIK3R2 mRNA expression was analyzed in different human lung cancer types using Oncomine, as described (www.oncomine.org) and we represented data obtained form Bhattacharjee et al. 2001 [30]. Gel band intensity was quantitated with ImageJ software (NIH). Significance was calculated with ANOVA, Chi square and Student’s t test using GraphPad Prism 5.0 (GraphPad Software).
ACKNOWLEDGMENTS
We thank C Mark for editorial assistance.
CONFLICTS OF INTEREST
The authors declare no conflicts of interest.
FUNDING
JVD held an FPI predoctoral fellowship from the Spanish Ministry of Education. This work was financed in part by grants from the Spanish Ministry of Science and Innovation (SAF2010-21019, SAF2013-48657 to ACC), the Network of Cooperative Research in Cancer (RTICC RD12/0036/0059 and RD12/0036/0040), the Madrid regional government (BMD2502), Instituto de Salud Carlos III-Fondo Europeo de Desarrollo Regional (PI13/00806 to LMM and PI14/01686 to RP) and Fundación Científica Asociación Española Contra el Cáncer (GCB14-2170).
REFERENCES
1. World Health Organization, International Agency for Research on Cancer. GLOBOCAN 2012: Estimated Cancer Incidence, Mortality and Prevalence Worldwide in 2012. Available online: http://globocan.iarc.fr/.
2. Filipits M. New developments in the treatment of squamous cell lung cancer. Curr Opin Oncol. 2014; 26:152-158.
3. Derman BA, Mileham KF, Bonomi PD, Batus M, Fidler MJ. Treatment of advanced squamous cell carcinoma of the lung: a review. Transl Lung Cancer Res. 2015;4:524-532.
4. Campbell JD, Alexandrov A, Kim J, Wala J, Berger AH, Pedamallu CS, Shukla SA, Guo G, Brooks AN, Murray BA, Imielinski M, Hu X, Ling S, et al. Cancer Genome Atlas Research Network, Artyomov MN, Schreiber R, Govindan R, Meyerson M. Distinct patterns of somatic genome alterations in lung adenocarcinomas and squamous cell carcinomas. Nat Genet. 2016;48:607-616.
5. Shtivelman E, Hensing T, Simon GR, Dennis PA, Otterson GA, Bueno R, Salgia R. Molecular pathways and therapeutic targets in lung cancer. Oncotarget. 2014;5:1392-1433. doi: 10.18632/oncotarget.1891.
6. Larsen JE, Minna JD. Molecular biology of lung cancer: clinical implications. Clin Chest Med. 2011;32:703-740.
7. Martincorena I, Campbell PJ. Somatic mutation in cancer and normal cells. Science. 2015;349:1483-1489.
8. Cancer Genome Atlas Research Network. Comprehensive genomic characterization of squamous cell lung cancers. Nature. 2012;489:519-525.
9. McCoach CE, Kelly K. Treatment paradigms in advanced non-small-cell lungcancer. Clin Adv Hematol Oncol. 2013;11:629-639.
10. Massion PP, Kuo WL, Stokoe D, Olshen AB, Treseler PA, Chin K, Chen C, Polikoff D, Jain AN, Pinkel D, Albertson DG, Jablons DM, Gray JW. Genomic copy number analysis of non-small cell lung cancer using array comparative genomic hybridization: implications of the PI 3-kinase pathway. Cancer Res. 2002;62:3636-3640.
11. Björkqvist AM, Husgafvel-Pursiainen K, Anttila S, Karjalainen A, Tammilehto L, Mattson K, Vainio H, Knuutila S. DNA gains in 3q occur frequently in squamous cell carcinoma of the lung, but not in adenocarcinoma. Genes Chromosomes Cancer. 1998;22:79-82.
12. Chalhoub N, Baker SJ. PTEN and the PI3-kinase pathway in cancer. Annu Rev Pathol. 2009;4:127-150.
13. Thorpe LM, Yuzugullu H, Zhao JJ. PI3K in cancer: divergent roles of isoforms, modes of activation and therapeutic targeting. Nat Rev Cancer. 2015;15:7-24.
14. Fruman DA, Rommel C. PI3K and cancer: lessons, challenges and opportunities. Nat Rev Drug Discov. 2014;13:140-156.
15. Rodon J, Dienstmann R, Serra V, Tabernero J. Development of PI3K inhibitors: lessons learned from early clinical trials. Nat Rev Clin Oncol. 2013;10:143-153.
16. Tan DS, Adjei AA. Toward High-Precision Genomic Biomarkers: The Importance of Context. J Thorac Oncol. 2015;10:1237-1239.
17. Vansteenkiste JF, Canon JL, Braud FD, Grossi F, De Pas T, Gray JE, Su WC, Felip E, Yoshioka H, Gridelli C, Dy GK, Thongprasert S, Reck M, et al. Safety and Efficacy of Buparlisib (BKM120) in Patients with PI3K Pathway-Activated Non-Small Cell Lung Cancer: Results from the Phase II BASALT-1 Study. J Thorac Oncol. 2015;10:1319-1327.
18. Chandarlapaty S, Sawai A, Scaltriti M, Rodrik-Outmezguine V, Grbovic-Huezo O, Serra V, Majumder PK, Baselga J, Rosen N. AKT inhibition relieves feedback suppression of receptor tyrosine kinase expression and activity. Cancer Cell. 2011;19:58-71.
19. Rodrik-Outmezguine VS, Chandarlapaty S, Pagano NC, Poulikakos PI, Scaltriti M, Moskatel E, Baselga J, Guichard S, Rosen N. mTOR kinase inhibition causes feedback-dependent biphasic regulation of AKT signaling. Cancer Discov. 2011;1:248–259.
20. O’Reilly KE, Rojo F, She QB, Solit D, Mills GB, Smith D, Lane H, Hofmann F, Hicklin DJ, Ludwig DL, Baselga J, Rosen N. mTOR inhibition induces upstream receptor tyrosine kinase signaling and activates Akt. Cancer Res. 2006;66:1500-1508.
21. Mendoza MC, Er EE, Blenis J. The Ras-ERK and PI3K-mTOR pathways: cross-talk and compensation. Trends Biochem Sci. 2011;36:320-8.
22. Klempner SJ, Myers AP, Cantley LC. What a tangled web we weave: emerging resistance mechanisms to inhibition of the phosphoinositide 3-kinase pathway. Cancer Discov. 2013; 3:1345-1354.
23. Engelman JA. Targeting PI3K signalling in cancer: opportunities, challenges and limitations. Nat Rev Cancer. 2009;9:550-562
24. Cortés I, Sánchez-Ruíz J, Zuluaga S, Calvanese V, Marqués M, Hernández C, Rivera T, Kremer L, González-García A, Carrera AC. p85β phosphoinositide 3-kinase subunit regulates tumor progression. Proc Natl Acad Sci U S A. 2012;109:11318-11323.
25. Cariaga-Martínez AE, Cortés I, García E, Pérez-García V, Pajares, MJ, Idoate MA, Redondo-Muñóz J, Antón IM, Carrera AC. Phosphoinositide 3-kinase p85beta regulates invadopodium formation. Biol Open. 2014;3:924-936.
26. Taniguchi CM, Winnay J, Kondo T, Bronson RT, Guimaraes AR, Alemán JO, Luo J, Stephanopoulos G, Weissleder R, Cantley LC, Kahn CR. The phosphoinositide 3-kinase regulatory subunit p85alpha can exert tumor suppressor properties through negative regulation of growth factor signaling. Cancer Res. 2010;70:5305-5315.
27. Yu J, Zhang Y, McIlroy J, Rordorf-Nikolic T, Orr GA, Backer JM. Regulation of the p85/p110 phosphatidylinositol 3’-kinase: stabilization and inhibition of the p110alpha catalytic subunit by the p85 regulatory subunit. Mol Cell Biol. 1998;18:1379-1387.
28. Ueki K, Fruman DA, Brachmann SM, Tseng YH, Cantley LC, Kahn CR. Molecular balance between the regulatory and catalytic subunits of phosphoinositide 3-kinase regulates cell signaling and survival. Mol Cell Biol. 2002;22:965-977.
29. Alcázar I, Cortés I, Zaballos A, Hernandez C, Fruman DA, Barber DF, Carrera AC. p85beta phosphoinositide 3-kinase regulates CD28 coreceptor function. Blood. 2009;113:3198-3208.
30. Bhattacharjee A, Richards WG, Staunton J, Li C, Monti S, Vasa P, Ladd C, Beheshti J, Bueno R, Gillette M, Loda M, Weber G, Mark EJ, Lander ES, et al. Classification of human lung carcinomas by mRNA expression profiling reveals distinct adenocarcinoma subclasses. Proc Natl Acad Sci U S A. 2001;98:13790-13795.
31. Garber ME, Troyanskaya OG, Schluens K, Petersen S, Thaesler Z, Pacyna-Gengelbach M, van de Rijn M, Rosen GD, Perou CM, Whyte RI, Altman RB, Brown PO, Botstein D, et al. Diversity of gene expression in adenocarcinoma of the lung. Proc Natl Acad Sci USA. 2001;98:13784-13789.
32. Hou J, Aerts J, den Hamer B, van Ijcken W, den Bakker M, Riegman P, van der Leest C, van der Spek P, Foekens JA, Hoogsteden HC, Grosveld F, Philipsen S. Gene expression-based classification of non-small cell lung carcinomas and survival prediction. PLoS One. 2010;5:e10312. doi: 10.1371/journal.pone.0010312.
33. Wachi S, Yoneda K, Wu R. Interactome-transcriptome analysis reveals the high centrality of genes differentially expressed in lung cancer tissues. Bioinformatics. 2005;21:4205-4208.
34. Roder J, Duwe A. The beige mutation in the mouse selectively impairs natural killer cell function. Nature. 1979;278:451-453.
35. García Z, Silio V, Marqués M, Cortés I, Kumar A, Hernandez C, Checa AI, Serrano A, Carrera AC. A PI3K activity-independent function of p85 regulatory subunit in control of mammalian cytokinesis. EMBO J. 2006; 18;25:4740-51
36. Costa C, Ebi H, Martini M, Beausoleil SA, Faber AC, Jakubik CT, Huang A, Wang Y, Nishtala M, Hall B, Rikova K, Zhao J, Hirsch E, et al. Measurement of PIP3 levels reveals an unexpected role for p110β in early adaptive responses to p110α-specific inhibitors in luminal breast cancer. Cancer Cell. 2015; 27:97-108.
37. Schwartz S, Wongvipat J, Trigwell CB, Hancox U, Carver BS, Rodrik-Outmezguine V, Will M, Yellen P, de Stanchina E, Baselga J, Scher HI, Barry ST, Sawyers CL, et al. Feedback suppression of PI3Kα signaling in PTEN-mutated tumors is relieved by selective inhibition of PI3Kβ. Cancer Cell. 2015; 27:109-122.
38. Shah OJ, Hunter T. Turnover of the active fraction of IRS1involves raptor-mTOR- and S6K1-dependent serine phosphorylation in cell culture models of tuberous sclerosis. Mol. Cell. Biol. 2006; 26:6425–6434.
39. Marqués M, Kumar A, Poveda AM, Zuluaga S, Hernández C, Jackson S, Pasero P, Carrera AC. Specific function of phosphoinositide 3-kinase beta in the control of DNA replication. Proc Natl Acad Sci U S A. 2009;106:7525-7530.
40. Awad MM, Oxnard GR, Jackman DM, Savukoski DO, Hall D, Shivdasani P, Heng JC, Dahlberg SE, Jänne PA, Verma S, Christensen J, Hammerman PS, Sholl LM. MET Exon14 Mutations in Non-Small-Cell Lung Cancer Are Associated With Advanced Age and Stage-Dependent MET Genomic Amplification and c-Met Overexpression. J Clin Oncol. 2016. pii: JCO634600. PubMed PMID: 26729443.
41. Brahmer J, Reckamp KL, Baas P, Crinò L, Eberhardt WE, Poddubskaya E, Antonia S, Pluzanski A, Vokes EE, Holgado E, Waterhouse D, Ready N, Gainor J, et al. Nivolumab versus Docetaxel inAdvanced Squamous-Cell Non-Small-Cell Lung Cancer. N Engl J Med. 2015;373:123-135.
42. Dienstmann R, Rodon J, Serra V, Tabernero J. Picking the point of inhibition: a comparative review of PI3K/AKT/mTOR pathway inhibitors. Mol Cancer Ther. 2014;13:1021-1031.
43. Shapiro GI, Bell-McGuinn KM, Molina JR, Bendell J, Spicer J, Kwak EL, Pandya SS, Millham R, Borzillo G, Pierce KJ, Han L, Houk BE, Gallo JD, et al. First-in-Human Study of PF-05212384 (PKI-587), a Small-Molecule, Intravenous, Dual Inhibitor of PI3K and mTOR in Patients with Advanced Cancer. Clin Cancer Res. 2015;21:1888-1895.
44. Ito Y, Hart JR, Ueno L, Vogt PK. Oncogenic activity of the regulatory subunit p85β of phosphatidylinositol 3-kinase (PI3K). Proc Natl Acad Sci U S A. 2014;111:16826-16829.
45. Rodriguez-Viciana P, Warne PH, Dhand R, Vanhaesebroeck B, Gout I, Fry MJ, Waterfield MD, Downward J. Phosphatidylinositol-3-OH kinase as a direct target of Ras. Nature. 1994;370:527-532.
46. Zhu X, Xu Y, Solis LM, Tao W, Wang L, Behrens C, Xu X, Zhao L, Liu D, Wu J, Zhang N, Wistuba II, Farokhzad OC, et al. Long-circulating siRNA nanoparticles for validating Prohibitin1-targeted non-small cell lung cancer treatment. Proc Natl Acad Sci USA. 2015;112:7779-7784.
47. Fujita Y, Kuwano K, Ochiya T. Development of small RNA delivery systems for lung cancer therapy. Int J Mol Sci. 2015;16:5254-5270.
48. Tabebordbar M, Zhu K, Cheng JK, Chew WL, Widrick JJ, Yan WX, Maesner C, Wu EY, Xiao R, Ran FA, Cong L, Zhang F, Vandenberghe LH, et al. In vivo gene editing in dystrophic mouse muscle and muscle stem cells. Science 2016;351:407-411.
49. Hong D, Kurzrock R, Kim Y, Woessner R, Younes A, Nemunaitis J, Fowler N, Zhou T, Schmidt J, Jo M, Lee SJ, Yamashita M, Hughes SG, et al. AZD9150, a next-generation antisense oligonucleotide inhibitor of STAT3 with early evidence of clinical activity in lymphoma and lung cancer. Sci Transl Med. 2015;7:314ra185.
50. Monteleone G, Neurath MF, Ardizzone S, Di Sabatino A, Fantini MC, Castiglione F, Scribano ML, Armuzzi A, Caprioli F, Sturniolo GC, Rogai F, Vecchi M, Atreya R, et al. An oral SMAD7 antisense oligonucleotide, and Crohn’s disease. N Engl J Med. 2015;372:1104-1113.
51. Tefferi A, Lasho TL, Begna KH, Patnaik M, Zblewski DL, Finke CM, Laborde RR, Wassie E, Schimek L, Hanson CA, Gangat N, Wang X, Pardanani A. A Pilot Study of the Telomerase Inhibitor Imetelstat for Myelofibrosis. N Engl J Med. 2015;373:908-919.
52. Thi EP, Mire CE, Lee AC, Geisbert JB, Zhou Z, Agans N, Snead NM, Deer DJ, Barnard TR, Fenton KA, MacLachlan I, Geisbert TW. Lipid nanoparticle siRNA treatment of Ebola-virus-Makona-infected nonhuman primates. Nature 2015;521:362-365.
53. Fujishita T, Loda M, Turner RE, Gentler M, Kashii T, Breathnach OS, Johnson BE. Sensitivity of non-small-cell lung cancer cell lines established from patients treated with prolonged infusions of Paclitaxel. Oncology. 2003;64:399-406.
54. Wiederschain D, Wee S, Chen L, Loo A, Yang G, Huang A, Chen Y, Caponigro G, Yao YM, Lengauer C, Sellers WR, Benson JD. Single-vector inducible lentiviral RNAi system for oncology target validation. Cell Cycle. 2009;8:498-504.
55. Larrayoz M, Pio R, Pajares MJ, Zudaire I, Ajona D, Casanovas O, Montuenga LM, Agorreta J. Contrasting responses of non-small cell lung cancer to antiangiogenic therapies depend on histological subtype. EMBO Mol Med. 2014;6:539-550.